HOT TOPICS LIST
- MACD
- Fibonacci
- RSI
- Gann
- ADXR
- Stochastics
- Volume
- Triangles
- Futures
- Cycles
- Volatility
- ZIGZAG
- MESA
- Retracement
- Aroon
INDICATORS LIST
LIST OF TOPICS
PRINT THIS ARTICLE
by David Penn
The resolution of this October/November triangle will tell a great deal about the bull market in cattle.
Position: N/A
David Penn
Technical Writer for Technical Analysis of STOCKS & COMMODITIES magazine, Working-Money.com, and Traders.com Advantage.
PRINT THIS ARTICLE
TRIANGLES
The Triangle In January Feeder Cattle
11/21/03 09:07:16 AMby David Penn
The resolution of this October/November triangle will tell a great deal about the bull market in cattle.
Position: N/A
| It seems as if every season in the commodities market has its star: in some years, it is the precious metals, in other years the grains "go wild." In recent months, an unheralded star in the commodities group has been livestock futures -- particularly cattle futures. Basis December, live cattle futures are up 30% since March. Basis January, feeder cattle futures are up some 28% percent over a similar time frame. Compared to gold, oil and the grains, livestock futures represent a smaller, less talked-out area of the market. But for those traders who have kept at least one eye on the cattle futures markets, the rewards have been significant in 2003. |
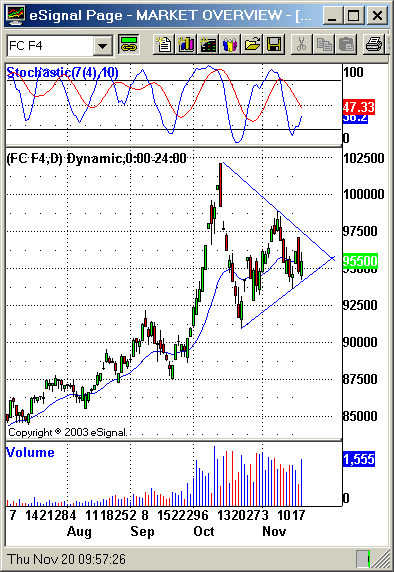
| Is there reason to believe that there are still further rewards to be enjoyed to the long side? The sizable triangle that has developed in January feeder cattle is certainly reason to start (or continue) paying attention to livestock. This triangle developed after a virtually parabolic move to the upside that had its origin in the late September lows around 87.5 cents per pound and reached its peak in early October at nearly $1.02 per pound. |

|
| Note the oversold condition of the stochastic oscillator as prices move within the symmetrical triangle. |
| Graphic provided by: eSignal. |
| |
| Feeder cattle fell back over the balance of the month. Prices found support at the level of the September highs (near 91 cents), and since have sawed back and forth in a narrowing range characteristic of a symmetrical triangle. A rally to near 99 cents was countered by a decline to about 93 cents -- all bounded by converging trendlines as the figure shows. |
| If there is a "problem" with symmetrical triangles, then it is that nothing in the formation itself can be used to anticipate direction. Unlike ascending and descending triangles, symmetrical triangles are by their very definition somewhat indefinite as to whether or not price action leaving the triangle will be to the upside or the downside. Clearly, one clue would be the previous trend. But because these triangles can develop as tops, there is no guarantee that the preceding trend will be resumed on the opposite side of the chart pattern. |
| Another clue might lie in the stochastic oscillator which is currently oversold. If this oscillator remains neutral to only mildly overbought as price moves up to test the topmost trendline in the triangle, then there is a strong chance that the breakout will be to the upside. There are also a few key levels worth watching -- namely, the 98.8 cent level to the upside and the 93.6 cent level to the downside -- that could serve as tests of resistance or support, respectively, to any move beyond the triangle's current boundaries. What sort of projections can be made based on this symmetrical triangle? Given a formation size of about 11.55 cents, and a possible breakout point at 95.5 cents, an initial advance to as high as $1.07 or an initial decline to as low as 84 cents are -- at the present time, outcomes worth watching for. |
Technical Writer for Technical Analysis of STOCKS & COMMODITIES magazine, Working-Money.com, and Traders.com Advantage.
| Title: | Technical Writer |
| Company: | Technical Analysis, Inc. |
| Address: | 4757 California Avenue SW |
| Seattle, WA 98116 | |
| Phone # for sales: | 206 938 0570 |
| Fax: | 206 938 1307 |
| Website: | www.Traders.com |
| E-mail address: | DPenn@traders.com |
Traders' Resource Links | |
| Charting the Stock Market: The Wyckoff Method -- Books | |
| Working-Money.com -- Online Trading Services | |
| Traders.com Advantage -- Online Trading Services | |
| Technical Analysis of Stocks & Commodities -- Publications and Newsletters | |
| Working Money, at Working-Money.com -- Publications and Newsletters | |
| Traders.com Advantage -- Publications and Newsletters | |
| Professional Traders Starter Kit -- Software | |
Click here for more information about our publications!
PRINT THIS ARTICLE

Request Information From Our Sponsors
- StockCharts.com, Inc.
- Candle Patterns
- Candlestick Charting Explained
- Intermarket Technical Analysis
- John Murphy on Chart Analysis
- John Murphy's Chart Pattern Recognition
- John Murphy's Market Message
- MurphyExplainsMarketAnalysis-Intermarket Analysis
- MurphyExplainsMarketAnalysis-Visual Analysis
- StockCharts.com
- Technical Analysis of the Financial Markets
- The Visual Investor
- VectorVest, Inc.
- Executive Premier Workshop
- One-Day Options Course
- OptionsPro
- Retirement Income Workshop
- Sure-Fire Trading Systems (VectorVest, Inc.)
- Trading as a Business Workshop
- VectorVest 7 EOD
- VectorVest 7 RealTime/IntraDay
- VectorVest AutoTester
- VectorVest Educational Services
- VectorVest OnLine
- VectorVest Options Analyzer
- VectorVest ProGraphics v6.0
- VectorVest ProTrader 7
- VectorVest RealTime Derby Tool
- VectorVest Simulator
- VectorVest Variator
- VectorVest Watchdog
