HOT TOPICS LIST
- MACD
- Fibonacci
- RSI
- Gann
- ADXR
- Stochastics
- Volume
- Triangles
- Futures
- Cycles
- Volatility
- ZIGZAG
- MESA
- Retracement
- Aroon
INDICATORS LIST
LIST OF TOPICS
PRINT THIS ARTICLE
by Gary Grosschadl
The Nasdaq, Dow and the S&P 500 all look dangerous.
Here is a look at the Nasdaq.
Position: Sell
Gary Grosschadl
Independent Canadian equities trader and technical analyst based in Peterborough
Ontario, Canada.
PRINT THIS ARTICLE
CHART ANALYSIS
Main Indexes In Turmoil
11/20/03 10:07:40 AMby Gary Grosschadl
The Nasdaq, Dow and the S&P 500 all look dangerous.
Here is a look at the Nasdaq.
Position: Sell
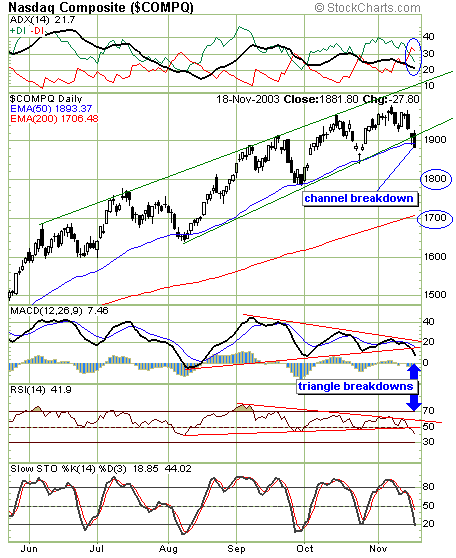
| For weeks now many chartists have pointed out negative divergences on the daily and weekly charts of the main indexes. Now it looks as if consequences are coming in recognizable forms. In the case of the Nasdaq, this daily chart shows the steep channel formation that has guided this index up the past several months. Now it is breaking to the downside. |

|
| Nasdaq daily chart showing a possible channel failure. |
| Graphic provided by: Stockcharts.com. |
| |
| Several indicators are also warning of negative change. The directional movement indicator at the top of the chart shows a bearish crossover of the DI lines. Should the ADX line now flatten and then reverse, then this adds fuel to bearish trend strength. |
| The MACD (moving average convergence/divergence) and the RSI (relative strength index)have been flashing their negative divergence warnings for some time. Now they are showing their own triangle breakdowns, another bearish development. Stochastics are low but still have room to fall. |
| How far can this index fall before a bounce is attempted? Impossible to say at this point, however two possibilities are marked. The 1800 area is a point of previous congestion that could offer some support and if this also fails then the next strong area of possible support lies close to the 200-day EMA being the 1700 area. Traders should be alert for a bounce attempt but beware a weak bounce as upside resistance could be significant. |
Independent Canadian equities trader and technical analyst based in Peterborough
Ontario, Canada.
| Website: | www.whatsonsale.ca/financial.html |
| E-mail address: | gwg7@sympatico.ca |
Click here for more information about our publications!
Comments
Date: 11/25/03Rank: 3Comment:

|

Request Information From Our Sponsors
- StockCharts.com, Inc.
- Candle Patterns
- Candlestick Charting Explained
- Intermarket Technical Analysis
- John Murphy on Chart Analysis
- John Murphy's Chart Pattern Recognition
- John Murphy's Market Message
- MurphyExplainsMarketAnalysis-Intermarket Analysis
- MurphyExplainsMarketAnalysis-Visual Analysis
- StockCharts.com
- Technical Analysis of the Financial Markets
- The Visual Investor
- VectorVest, Inc.
- Executive Premier Workshop
- One-Day Options Course
- OptionsPro
- Retirement Income Workshop
- Sure-Fire Trading Systems (VectorVest, Inc.)
- Trading as a Business Workshop
- VectorVest 7 EOD
- VectorVest 7 RealTime/IntraDay
- VectorVest AutoTester
- VectorVest Educational Services
- VectorVest OnLine
- VectorVest Options Analyzer
- VectorVest ProGraphics v6.0
- VectorVest ProTrader 7
- VectorVest RealTime Derby Tool
- VectorVest Simulator
- VectorVest Variator
- VectorVest Watchdog
