HOT TOPICS LIST
- MACD
- Fibonacci
- RSI
- Gann
- ADXR
- Stochastics
- Volume
- Triangles
- Futures
- Cycles
- Volatility
- ZIGZAG
- MESA
- Retracement
- Aroon
INDICATORS LIST
LIST OF TOPICS
PRINT THIS ARTICLE
by Gary Grosschadl
The price of crude oil has been testing overhead resistance and will be making a decisive move from here but which way?
Position: Hold
Gary Grosschadl
Independent Canadian equities trader and technical analyst based in Peterborough
Ontario, Canada.
PRINT THIS ARTICLE
HEAD & SHOULDERS
Is Oil Topping Out?
11/18/03 07:51:10 AMby Gary Grosschadl
The price of crude oil has been testing overhead resistance and will be making a decisive move from here but which way?
Position: Hold
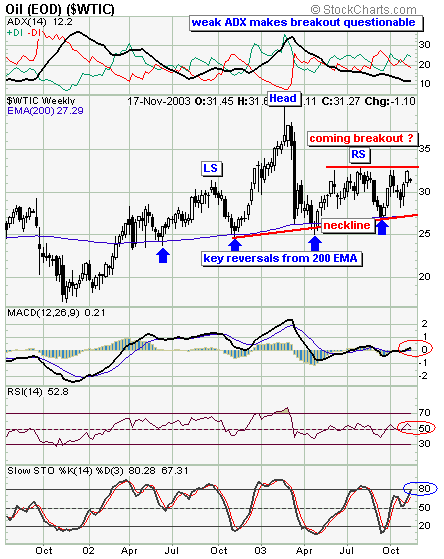
| As the weekly chart shows, the price of crude has had good support above its 200-period EMA (exponential moving average) for the past 18 months. In doing so it has traced out a possible topping pattern via a head and shoulders formation. This 200-period EMA for practical purposes serves as a slanted neckline. The bottom of the right shoulder survived a test of the pattern and the bearish move down last September was negated. Now the top of that shoulder is being tested a second time. |
| There is obvious resistance at that $33 level as it has been tested four times since last May. Is this pointing to a coming breakout or a return to another neckline test? Several indicators can help give insight here. |

|
| Weekly chart shows the pattern challenge oil is facing. |
| Graphic provided by: Stockcharts.com. |
| |
| The trend strength indicator at the top of the chart hints at a lack of directional power which makes a breakout questionable. Although the DIs are in bullish form, the ADX, or strength component, is very weak at 12.2 and too far from the DIs to make a bullish argument. The remaining indicators all show a similar predicament, being at potential stall levels. Under nontrending conditions, as the weak ADX suggests, the stochastic oscillator is often a very reliable upleg/downleg indicator. Typically downturns from the 80 level occur in overbought conditions and this 80 mark has been reached so a downturn could ensue very soon. |
| Failure to break through this upside barrier at $33 will most likely result in another test of the pattern neckline at $27. Traders should be prepared for an important move at that critical juncture. Either a head and shoulders pattern coming to downside fruition or yet another upside bounce; either way it should be tradeable. |
Independent Canadian equities trader and technical analyst based in Peterborough
Ontario, Canada.
| Website: | www.whatsonsale.ca/financial.html |
| E-mail address: | gwg7@sympatico.ca |
Click here for more information about our publications!
PRINT THIS ARTICLE

Request Information From Our Sponsors
- StockCharts.com, Inc.
- Candle Patterns
- Candlestick Charting Explained
- Intermarket Technical Analysis
- John Murphy on Chart Analysis
- John Murphy's Chart Pattern Recognition
- John Murphy's Market Message
- MurphyExplainsMarketAnalysis-Intermarket Analysis
- MurphyExplainsMarketAnalysis-Visual Analysis
- StockCharts.com
- Technical Analysis of the Financial Markets
- The Visual Investor
- VectorVest, Inc.
- Executive Premier Workshop
- One-Day Options Course
- OptionsPro
- Retirement Income Workshop
- Sure-Fire Trading Systems (VectorVest, Inc.)
- Trading as a Business Workshop
- VectorVest 7 EOD
- VectorVest 7 RealTime/IntraDay
- VectorVest AutoTester
- VectorVest Educational Services
- VectorVest OnLine
- VectorVest Options Analyzer
- VectorVest ProGraphics v6.0
- VectorVest ProTrader 7
- VectorVest RealTime Derby Tool
- VectorVest Simulator
- VectorVest Variator
- VectorVest Watchdog
