HOT TOPICS LIST
- MACD
- Fibonacci
- RSI
- Gann
- ADXR
- Stochastics
- Volume
- Triangles
- Futures
- Cycles
- Volatility
- ZIGZAG
- MESA
- Retracement
- Aroon
INDICATORS LIST
LIST OF TOPICS
PRINT THIS ARTICLE
by David Penn
Is it time for bargain-hunting in the retail sector?
Position: N/A
David Penn
Technical Writer for Technical Analysis of STOCKS & COMMODITIES magazine, Working-Money.com, and Traders.com Advantage.
PRINT THIS ARTICLE
THE DIAMOND
The Retail HOLDRs Diamond Top
11/18/03 08:42:48 AMby David Penn
Is it time for bargain-hunting in the retail sector?
Position: N/A
| In a recent article, I used some of the thinking in Dow theory to understand what the weak close on Friday, November 14th meant for the following week ("Time-out For Transports?," Traders.com Advantage, November 17, 2003). At the time, it appeared that a bearish position was the most reasonable stance to take going into the following week insofar as a head and shoulders top had formed on the hourly chart of the Dow Transports. This most directly anticipated early in the week softness, with the possibility of a rebound in the market once the target for the Dow Transports' hourly head and shoulders top was reached. |
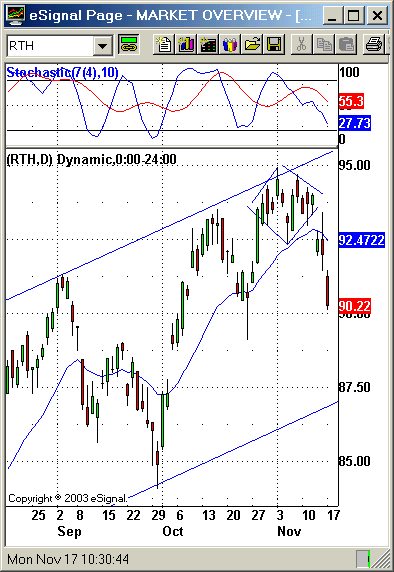
| Other evidence of weakness (and again, this is temporary weakness in a cyclical bull market or bear market rally) comes in the form of the diamond top that developed in a daily chart of the retail HOLDRs. Because most stock market advances in recent years have been lead by -- alternately -- financials, semiconductors, Internets and retails -- I have looked to the HOLDRs of these groups (RKH, SMH, HHH, RTH, respectively) as one way of gauging the strength and progress of this bull market. |

|
| Resistance at the top of this trend channel as well as an overbought stochastic underscore the bearish portents of this diamond top in the retail HOLDRs. |
| Graphic provided by: eSignal. |
| |
| The retail HOLDRs, RTH, showed perhaps the clearest "top" of the four. While the other three HOLDRs also began moving down late in October, only the RTH formed a textbook pattern -- the diamond top -- that would have helped traders and investors position themselves in advance of likely weakness in the days to come. |
| The diamond in the RTH is about eleven days long, beginning on October 28 and ending with the sharp break on November 13th -- over one week before the Dow Transports completed its bearish head and shoulders top in the hourly chart mentioned above. This diamond comes after RTH had rallied from 85 in late September to a pattern high just shy of 95 about one month later (a near 12% gain in 30 days). |
| But did this diamond represent a top, or perhaps merely a continuation? To answer this question, consider the stochastic indicator in the uppermost frame. First note the higher price peak in late October relative to the price peak in early October -- while at the same time the stochastic indicator accorded the same price action with consecutively lower peaks. This negative divergence between prices and the oscillator points to the likelihood that the breakout from the diamond pattern would be downward -- which it proved to be rather quickly. Prices did in fact break down, not only breaking free from the diamond pattern to the downside by also doing so in a sharp gap-down fashion. Prices consolidated for a day, before gapping down again. Two gaps in the same direction in three days is pretty suggestive of a short-term change in trend. But what sort of downside might the diamond top project? Given a formation size of about 2.7 and a breakdown point at about 93.5 (lower, at 92.3 if you use the first price of the gap down/breakout day), a likely downside target exists in the range of 90.8 to 89.6. Should the RTH fall to the lower end of this range, be on the look out for a test of recent lows from October 24 at about 89. |
Technical Writer for Technical Analysis of STOCKS & COMMODITIES magazine, Working-Money.com, and Traders.com Advantage.
| Title: | Technical Writer |
| Company: | Technical Analysis, Inc. |
| Address: | 4757 California Avenue SW |
| Seattle, WA 98116 | |
| Phone # for sales: | 206 938 0570 |
| Fax: | 206 938 1307 |
| Website: | www.Traders.com |
| E-mail address: | DPenn@traders.com |
Traders' Resource Links | |
| Charting the Stock Market: The Wyckoff Method -- Books | |
| Working-Money.com -- Online Trading Services | |
| Traders.com Advantage -- Online Trading Services | |
| Technical Analysis of Stocks & Commodities -- Publications and Newsletters | |
| Working Money, at Working-Money.com -- Publications and Newsletters | |
| Traders.com Advantage -- Publications and Newsletters | |
| Professional Traders Starter Kit -- Software | |
Click here for more information about our publications!
PRINT THIS ARTICLE

|

Request Information From Our Sponsors
- StockCharts.com, Inc.
- Candle Patterns
- Candlestick Charting Explained
- Intermarket Technical Analysis
- John Murphy on Chart Analysis
- John Murphy's Chart Pattern Recognition
- John Murphy's Market Message
- MurphyExplainsMarketAnalysis-Intermarket Analysis
- MurphyExplainsMarketAnalysis-Visual Analysis
- StockCharts.com
- Technical Analysis of the Financial Markets
- The Visual Investor
- VectorVest, Inc.
- Executive Premier Workshop
- One-Day Options Course
- OptionsPro
- Retirement Income Workshop
- Sure-Fire Trading Systems (VectorVest, Inc.)
- Trading as a Business Workshop
- VectorVest 7 EOD
- VectorVest 7 RealTime/IntraDay
- VectorVest AutoTester
- VectorVest Educational Services
- VectorVest OnLine
- VectorVest Options Analyzer
- VectorVest ProGraphics v6.0
- VectorVest ProTrader 7
- VectorVest RealTime Derby Tool
- VectorVest Simulator
- VectorVest Variator
- VectorVest Watchdog
