HOT TOPICS LIST
- MACD
- Fibonacci
- RSI
- Gann
- ADXR
- Stochastics
- Volume
- Triangles
- Futures
- Cycles
- Volatility
- ZIGZAG
- MESA
- Retracement
- Aroon
INDICATORS LIST
LIST OF TOPICS
PRINT THIS ARTICLE
by Gary Grosschadl
The TSX Gold Index shows a potentially powerful pattern developing.
Position: Buy
Gary Grosschadl
Independent Canadian equities trader and technical analyst based in Peterborough
Ontario, Canada.
PRINT THIS ARTICLE
CUP WITH HANDLE
Gold Tries A Daring Move
11/14/03 08:48:49 AMby Gary Grosschadl
The TSX Gold Index shows a potentially powerful pattern developing.
Position: Buy
| On November 12, 2003 several gold indices made a strong move up as the gold spot price jumped to a seven year high of $395.50 and closed strongly at $394.20. On an intraday basis the Canadian TSX Gold Index broke into a year high ahead of the more well known XAU Gold Index and the HUI Gold Index. |
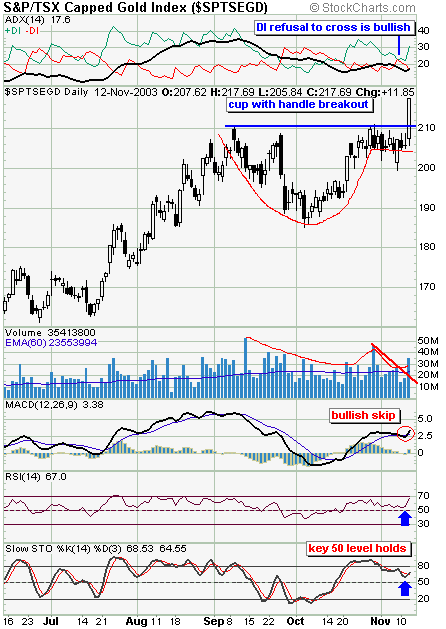
| On a daily chart this Canadian gold index shows a cup with handle breakout pattern very clearly. This is often a strong continuation pattern if it holds. The volume characteristic meets the pattern ideal with its own tracing out of a bowl or cup pattern and then a volume surge with the breakout move. |

|
| The TSX Gold Index in a pattern breakout move. |
| Graphic provided by: Stockcharts.com. |
| |
| Several indicators also support the bullish premise. The directional movement index (top of the chart) with its ADX and DI components shows bullish promise. The DI lines converged but refused to cross and this often indicates the start of a powerful move. The ADX line (trend strength component) has started its upslope between the DI lines. This ideal arrangement points to growing trend strength provided that the ADX line continues rising. The MACD or moving average convergence/divergence indicator also has traced out its own cup with handle formation and shows a bullish "skip" off its signal line. The other displayed indicators (RSI - relative strength index and stochastics) also show a bullish bias as they turn up from their often key 50 levels. |
| What is needed now is confirmation that this move is sustainable. The ideal would be continued upward momentum but a retest of this breakout point should not be ruled out. Failure of this 210 level to hold on a closing basis would negate the bullishness of this continuation pattern. |
Independent Canadian equities trader and technical analyst based in Peterborough
Ontario, Canada.
| Website: | www.whatsonsale.ca/financial.html |
| E-mail address: | gwg7@sympatico.ca |
Click here for more information about our publications!
Comments
Date: 11/22/03Rank: 5Comment: Useful and practical.

Request Information From Our Sponsors
- VectorVest, Inc.
- Executive Premier Workshop
- One-Day Options Course
- OptionsPro
- Retirement Income Workshop
- Sure-Fire Trading Systems (VectorVest, Inc.)
- Trading as a Business Workshop
- VectorVest 7 EOD
- VectorVest 7 RealTime/IntraDay
- VectorVest AutoTester
- VectorVest Educational Services
- VectorVest OnLine
- VectorVest Options Analyzer
- VectorVest ProGraphics v6.0
- VectorVest ProTrader 7
- VectorVest RealTime Derby Tool
- VectorVest Simulator
- VectorVest Variator
- VectorVest Watchdog
- StockCharts.com, Inc.
- Candle Patterns
- Candlestick Charting Explained
- Intermarket Technical Analysis
- John Murphy on Chart Analysis
- John Murphy's Chart Pattern Recognition
- John Murphy's Market Message
- MurphyExplainsMarketAnalysis-Intermarket Analysis
- MurphyExplainsMarketAnalysis-Visual Analysis
- StockCharts.com
- Technical Analysis of the Financial Markets
- The Visual Investor
