HOT TOPICS LIST
- MACD
- Fibonacci
- RSI
- Gann
- ADXR
- Stochastics
- Volume
- Triangles
- Futures
- Cycles
- Volatility
- ZIGZAG
- MESA
- Retracement
- Aroon
INDICATORS LIST
LIST OF TOPICS
PRINT THIS ARTICLE
by David Penn
A test of the successful breakout from this intraday cup with handle bottom in the e-mini S&P 500 sets the stage for continued gains.
Position: N/A
David Penn
Technical Writer for Technical Analysis of STOCKS & COMMODITIES magazine, Working-Money.com, and Traders.com Advantage.
PRINT THIS ARTICLE
CUP WITH HANDLE
An Intraday Cup With Handle
11/13/03 01:05:34 PMby David Penn
A test of the successful breakout from this intraday cup with handle bottom in the e-mini S&P 500 sets the stage for continued gains.
Position: N/A
| Given the level of continued anxiety in the markets, one could be forgiven for forgetting that the S&P 500 is above 1,000 and has remained so since October. During the "twisting in the wind" that was the trading range in the S&P 500 over the summer months, the market struggled to stay above the quadruple digit level. Now that it has done so for two months, anxiety has shifted elsewhere, particularly to the question of the holding ground above the October -- and now early November -- highs just north of 1060. |
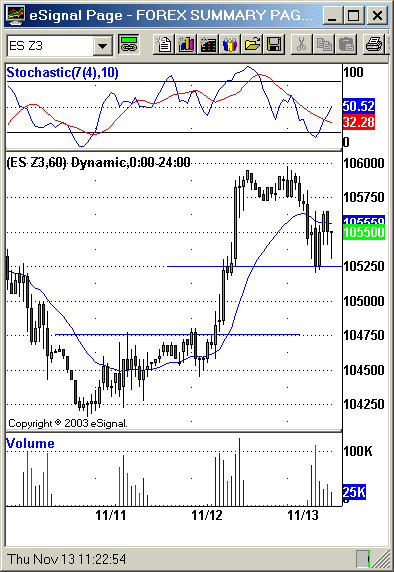
| The most recent advance toward 1060 has come as a result of a cup with handle bottom that is easy to see on this hourly chart of the e-mini S&P 500 futures contract. Prices had declined relatively steadily from the highs of November 7th (near 1063) to a low of about 1042 by the beginning of the following week. Prices moved up a few points, retreated without setting a new low, and then moved up again, breaking through resistance at the 1047.50 level. This price action created the bullish cup with handle pattern and -- given the measurement rule for such formations -- anticipated a move to about 1052.50. |

|
| The upside target from this cup with handle serves as support, as the market retreats from post-breakout highs. |
| Graphic provided by: eSignal. |
| |
| Measurement rules for patterns such as head and shoulders, cup with handles, triangles and so on are generally considered to be minimum moves based solely on the "swing" of the price pattern (as if it were a geometric shape) around the "hinge" of support or resistance. Such was certainly the case here with ESZ3 as prices reached the upside objective at 1052.50, consolidated very briefly, and then rocketed upward to a high of 1059.50. |
| What is especially interesting about this breakout is how, during its pullback, it has found support at the upside price objective from the breakout from the cup with handle bottom. Whether this support level holds or not remains to be seen. But those with a bullish inclination toward the S&P 500 should take heart in the ability of prices to hold up at these levels. |
Technical Writer for Technical Analysis of STOCKS & COMMODITIES magazine, Working-Money.com, and Traders.com Advantage.
| Title: | Technical Writer |
| Company: | Technical Analysis, Inc. |
| Address: | 4757 California Avenue SW |
| Seattle, WA 98116 | |
| Phone # for sales: | 206 938 0570 |
| Fax: | 206 938 1307 |
| Website: | www.Traders.com |
| E-mail address: | DPenn@traders.com |
Traders' Resource Links | |
| Charting the Stock Market: The Wyckoff Method -- Books | |
| Working-Money.com -- Online Trading Services | |
| Traders.com Advantage -- Online Trading Services | |
| Technical Analysis of Stocks & Commodities -- Publications and Newsletters | |
| Working Money, at Working-Money.com -- Publications and Newsletters | |
| Traders.com Advantage -- Publications and Newsletters | |
| Professional Traders Starter Kit -- Software | |
Click here for more information about our publications!
PRINT THIS ARTICLE

Request Information From Our Sponsors
- StockCharts.com, Inc.
- Candle Patterns
- Candlestick Charting Explained
- Intermarket Technical Analysis
- John Murphy on Chart Analysis
- John Murphy's Chart Pattern Recognition
- John Murphy's Market Message
- MurphyExplainsMarketAnalysis-Intermarket Analysis
- MurphyExplainsMarketAnalysis-Visual Analysis
- StockCharts.com
- Technical Analysis of the Financial Markets
- The Visual Investor
- VectorVest, Inc.
- Executive Premier Workshop
- One-Day Options Course
- OptionsPro
- Retirement Income Workshop
- Sure-Fire Trading Systems (VectorVest, Inc.)
- Trading as a Business Workshop
- VectorVest 7 EOD
- VectorVest 7 RealTime/IntraDay
- VectorVest AutoTester
- VectorVest Educational Services
- VectorVest OnLine
- VectorVest Options Analyzer
- VectorVest ProGraphics v6.0
- VectorVest ProTrader 7
- VectorVest RealTime Derby Tool
- VectorVest Simulator
- VectorVest Variator
- VectorVest Watchdog
