HOT TOPICS LIST
- MACD
- Fibonacci
- RSI
- Gann
- ADXR
- Stochastics
- Volume
- Triangles
- Futures
- Cycles
- Volatility
- ZIGZAG
- MESA
- Retracement
- Aroon
INDICATORS LIST
LIST OF TOPICS
PRINT THIS ARTICLE
by Kevin Hopson
Brigham Exploration looks to be forming a cup with handle pattern but there are factors to consider when trying to confirm this.
Position: Hold
Kevin Hopson
Kevin has been a technical analyst for roughly 10 years now. Previously, Kevin owned his own business and acted as a registered investment advisor, specializing in energy. He was also a freelance oil analyst for Orient Trading Co., a commodity futures trading firm in Japan. Kevin is currently a freelance writer.
PRINT THIS ARTICLE
CUP WITH HANDLE
A Potential Cup With Handle Pattern For Brigham Exploration?
11/13/03 11:40:32 AMby Kevin Hopson
Brigham Exploration looks to be forming a cup with handle pattern but there are factors to consider when trying to confirm this.
Position: Hold
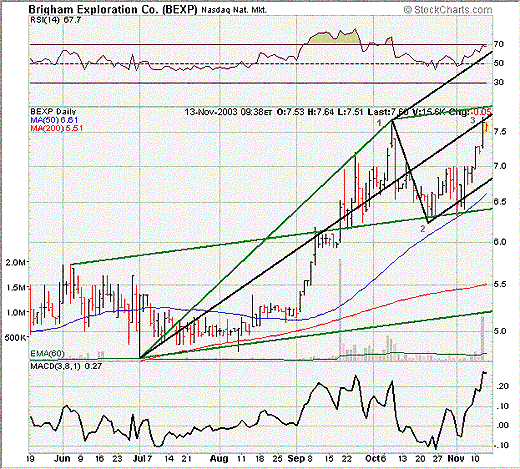
| I touched on Brigham Exploration (BEXP) a few weeks ago, saying that the stock could make its way up to the $7.90 level in the near-term based on the bullish triangle breakout in early October. Though Brigham did not quite make it that high (topped out around $7.70), the projected move was correct, nonetheless. After topping out here (as illustrated by pivot point 1), the stock proceeded to pull back, eventually finding support along the green median line and the 50-day moving average. Since then, Brigham has made its way back up to October's high around the $7.70 level, as illustrated by pivot point 3. As you can see in the chart, the stock is finding near-term resistance at this level, which is also the site of the black median line. |
| However, if you look at pivot points 1, 2 and 3, you will notice a potential cup with handle pattern forming. Although it should be more of a U-shape (than a V-shape) at the bottom of this formation, the pattern is developed enough to warrant our attention. What you want to look for now is a sideways (trading range) or declining (falling channel) consolidation period on lighter volume. This is normally the setup before a breakout occurs. Also, Brigham should stay above the 38.2 percent retracement level from the Oct.-Nov. rally ($7.17) during this consolidation period. Any behavior other than that and the pattern will likely fail. |

|
| Graphic provided by: Stockcharts.com. |
| |
| If things play out as they should though, watch for a breach of resistance at the $7.70 level (on higher than normal volume) as confirmation of a breakout. If Brigham is successful in breaking to the upside, the stock could make its way up to the $9.00 level in the near-term. I calculated this price target by taking the difference between pivot 1 and pivot 2 ($1.40) and adding it to the potential breakout point ($7.70+$1.40=$9.10). In the meantime, I would continue to hold shares of Brigham Exploration. |
Kevin has been a technical analyst for roughly 10 years now. Previously, Kevin owned his own business and acted as a registered investment advisor, specializing in energy. He was also a freelance oil analyst for Orient Trading Co., a commodity futures trading firm in Japan. Kevin is currently a freelance writer.
| Glen Allen, VA | |
| E-mail address: | hopson_1@yahoo.com |
Click here for more information about our publications!
PRINT THIS ARTICLE

Request Information From Our Sponsors
- VectorVest, Inc.
- Executive Premier Workshop
- One-Day Options Course
- OptionsPro
- Retirement Income Workshop
- Sure-Fire Trading Systems (VectorVest, Inc.)
- Trading as a Business Workshop
- VectorVest 7 EOD
- VectorVest 7 RealTime/IntraDay
- VectorVest AutoTester
- VectorVest Educational Services
- VectorVest OnLine
- VectorVest Options Analyzer
- VectorVest ProGraphics v6.0
- VectorVest ProTrader 7
- VectorVest RealTime Derby Tool
- VectorVest Simulator
- VectorVest Variator
- VectorVest Watchdog
- StockCharts.com, Inc.
- Candle Patterns
- Candlestick Charting Explained
- Intermarket Technical Analysis
- John Murphy on Chart Analysis
- John Murphy's Chart Pattern Recognition
- John Murphy's Market Message
- MurphyExplainsMarketAnalysis-Intermarket Analysis
- MurphyExplainsMarketAnalysis-Visual Analysis
- StockCharts.com
- Technical Analysis of the Financial Markets
- The Visual Investor
