

HOT TOPICS LIST
- MACD
- Fibonacci
- RSI
- Gann
- ADXR
- Stochastics
- Volume
- Triangles
- Futures
- Cycles
- Volatility
- ZIGZAG
- MESA
- Retracement
- Aroon
INDICATORS LIST
LIST OF TOPICS
PRINT THIS ARTICLE
by Koos van der Merwe
I have always believed that the Dow is tracing a B-wave upwards simply because of the time scale, where the trend from January 2000 downtrend ending in October 2002 was wave A of an ABC downtrend with the high in January 2000 being a fifth wave top.
Position: Accumulate
Koos van der Merwe
Has been a technical analyst since 1969, and has worked as a futures and options trader with First Financial Futures in Johannesburg, South Africa.
PRINT THIS ARTICLE
ELLIOTT WAVE
A Feasible Wave Count For The Dow
11/11/03 01:38:23 PMby Koos van der Merwe
I have always believed that the Dow is tracing a B-wave upwards simply because of the time scale, where the trend from January 2000 downtrend ending in October 2002 was wave A of an ABC downtrend with the high in January 2000 being a fifth wave top.
Position: Accumulate
| My reason for this count was that the current bull run (WAVE III) started in December 1974 (the bear market of 1969 to 1974 being WAVE II), and continued until January 2000, a period of 26 years. The subsequent bear market of two years, from January 2000 to October 2002, simply does not appear to be long enough. Bear markets are usually 38.2%, or close to this Fibonacci figure, meaning the bear market should only end in the year 2009 (38.2% of 26 years = 9.9 years). Add this to January 2000 and you get September 2009. However as every Elliottician knows, you should always have an alternate count ready should assumptions turn out to be wrong. For this reason I have prepared my alternate wave count of the Dow. |
| In the chart, do note the following: 1. Wave IV bottomed on October 31, 2002, and wave V appears to have completed waves 1 and 2 and is presently in a wave 3 of a wave V upwards. 2. The strength shown by wave V is reflected in the RSI indicator below, which broke below the 32 level with the October 2002 low, and is moving upwards. Here I have chosen 32 and 80 as the buy/sell extremes. The RSI has just broken the 56 level. There is still some way upwards to go before it breaks above the 80 level. Note that previous interwave buy signals were given when the RSI broke below and then moved above the 56 level. 3. Gann fans drawn from the low of December 1974 to the high in of January 2000 and redrawn downwards from January 2000 in the same scale, suggest that the Dow still has some way to go upwards before it breaks the 1 x 1 (red) Gann fan line. This could be a resistance level and be either the start of wave 4 of wave V or an internal wave i of wave 3. December 2005 could therefore be the target date for the completion of wave V and the start of a major bear market. 4. The three moving averages shown on the chart are: red 52-day; green, 120-day, and light blue 200-day. Note how the Dow appeared to find support at the 120-day moving average. 5. Fibonacci extension targets of wave I from the bottom of wave IV suggest the following targets for wave V. 1.618 = 10593 2.618 = 12668. This will give the RSI indicator plenty of time to form a divergence sell signal, something it appears to favor with this chart. 6. Finally, note the resistance level at the 1,618 Fibonacci level, at 10593, which is the top of the B-wave of wave IV. |
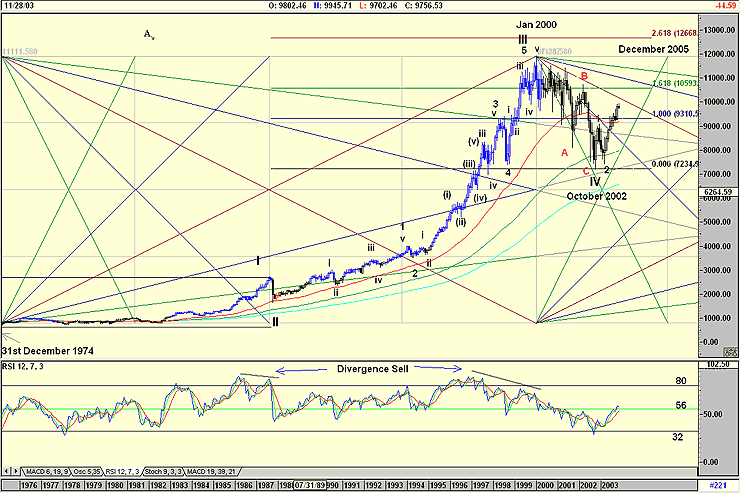
|
| Mothly chart of the Dow with an Elliott count and Gann fans. |
| Graphic provided by: AdvancedGET. |
| |
| The chart looks very convincing and as I mentioned I would accept it were it not for the time scale. A wave V retracement will fall somewhere between 12000 and 7235, the fourth wave of lesser degree, which is bearable. Let us hope this chart becomes prime. |
Has been a technical analyst since 1969, and has worked as a futures and options trader with First Financial Futures in Johannesburg, South Africa.
| Address: | 3256 West 24th Ave |
| Vancouver, BC | |
| Phone # for sales: | 6042634214 |
| E-mail address: | petroosp@gmail.com |
Click here for more information about our publications!
Comments
Date:�11/12/03Rank:�3Comment:�
Date:�11/16/03Rank:�4Comment:�

Request Information From Our Sponsors
- StockCharts.com, Inc.
- Candle Patterns
- Candlestick Charting Explained
- Intermarket Technical Analysis
- John Murphy on Chart Analysis
- John Murphy's Chart Pattern Recognition
- John Murphy's Market Message
- MurphyExplainsMarketAnalysis-Intermarket Analysis
- MurphyExplainsMarketAnalysis-Visual Analysis
- StockCharts.com
- Technical Analysis of the Financial Markets
- The Visual Investor
- VectorVest, Inc.
- Executive Premier Workshop
- One-Day Options Course
- OptionsPro
- Retirement Income Workshop
- Sure-Fire Trading Systems (VectorVest, Inc.)
- Trading as a Business Workshop
- VectorVest 7 EOD
- VectorVest 7 RealTime/IntraDay
- VectorVest AutoTester
- VectorVest Educational Services
- VectorVest OnLine
- VectorVest Options Analyzer
- VectorVest ProGraphics v6.0
- VectorVest ProTrader 7
- VectorVest RealTime Derby Tool
- VectorVest Simulator
- VectorVest Variator
- VectorVest Watchdog