

HOT TOPICS LIST
- MACD
- Fibonacci
- RSI
- Gann
- ADXR
- Stochastics
- Volume
- Triangles
- Futures
- Cycles
- Volatility
- ZIGZAG
- MESA
- Retracement
- Aroon
INDICATORS LIST
LIST OF TOPICS
PRINT THIS ARTICLE
by Gary Grosschadl
GE needs to find support here or a bigger downside support test is approaching.
Position: Hold
Gary Grosschadl
Independent Canadian equities trader and technical analyst based in Peterborough
Ontario, Canada.
PRINT THIS ARTICLE
DOUBLE TOPS
General Electric's Downside Challenge
11/11/03 09:44:44 AMby Gary Grosschadl
GE needs to find support here or a bigger downside support test is approaching.
Position: Hold
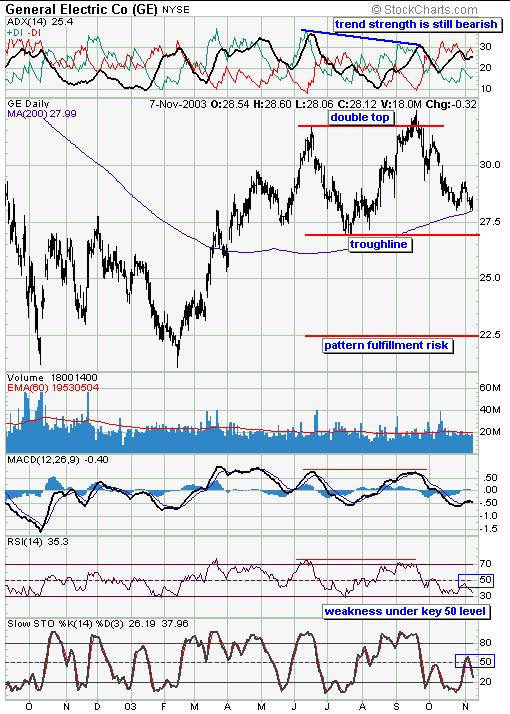
| This daily chart shows a double top test may be coming. A true double top pattern occurs when the troughline is broken to the downside and then runs to a downside completion target equal to the upside measure between top and trough. Traders seeing a possible double top have two reactions points to play, the first being the downside move towards the troughline and the second being the actual troughline test should the decline go that far. |
| The 200-day moving average, a prominent moving average watched by chartists, is now a factor to be considered. A bounce here may save the stock from the bigger trough test at $27. |
|
| GE's daily chart shows coming support tests and double top considerations. |
| Graphic provided by: Stockcharts.com. |
| |
| Examining several indicators may help to determine whether the 200-day MA can hold. The trend strength indicator at the top of the chart still shows a bearish trend (-DI over +DI) in effect although the first signs of these lines starting to converge has started. Currently the RSI (relative strength index) and stochastics both show weakness under their respective 50 levels and have yet to show signs of turning up. |
| The indicators discussed do not support the notion of an immediate bounce off the 200-day MA. A move down to test the troughline is then a likely outcome. By that time the stock will be technically oversold and due for a bounce of some sort. The next move then becomes rather important as the moving average could then act as stiff overhead resistance. If this is the case, then the troughline may be retested with perhaps a more ominious result. The other side of the coin to consider is that a strong move may push past the 200-day MA which sets up a possible strong drive north. |
| Traders should watch for likely moves off these two important lines, the 200-day MA and the double top troughline, being prepared for downside or upside potential as they develop. |
Independent Canadian equities trader and technical analyst based in Peterborough
Ontario, Canada.
| Website: | www.whatsonsale.ca/financial.html |
| E-mail address: | gwg7@sympatico.ca |
Click here for more information about our publications!
Comments
Date:�11/12/03Rank:�4Comment:�

Request Information From Our Sponsors
- StockCharts.com, Inc.
- Candle Patterns
- Candlestick Charting Explained
- Intermarket Technical Analysis
- John Murphy on Chart Analysis
- John Murphy's Chart Pattern Recognition
- John Murphy's Market Message
- MurphyExplainsMarketAnalysis-Intermarket Analysis
- MurphyExplainsMarketAnalysis-Visual Analysis
- StockCharts.com
- Technical Analysis of the Financial Markets
- The Visual Investor
- VectorVest, Inc.
- Executive Premier Workshop
- One-Day Options Course
- OptionsPro
- Retirement Income Workshop
- Sure-Fire Trading Systems (VectorVest, Inc.)
- Trading as a Business Workshop
- VectorVest 7 EOD
- VectorVest 7 RealTime/IntraDay
- VectorVest AutoTester
- VectorVest Educational Services
- VectorVest OnLine
- VectorVest Options Analyzer
- VectorVest ProGraphics v6.0
- VectorVest ProTrader 7
- VectorVest RealTime Derby Tool
- VectorVest Simulator
- VectorVest Variator
- VectorVest Watchdog