HOT TOPICS LIST
- MACD
- Fibonacci
- RSI
- Gann
- ADXR
- Stochastics
- Volume
- Triangles
- Futures
- Cycles
- Volatility
- ZIGZAG
- MESA
- Retracement
- Aroon
INDICATORS LIST
LIST OF TOPICS
PRINT THIS ARTICLE
by Andrew Hetherington
After a hard fall, the stock for Akamai Technologies (AKAM) has accumulated and started to rise again.
Position: N/A
Andrew Hetherington
Classic Dow Theorist who trades as a pure technician, using pattern recognition.
PRINT THIS ARTICLE
CHART ANALYSIS
Akamai Technologies Finally Begins To Fulfill IPO Furor
11/11/03 10:09:49 AMby Andrew Hetherington
After a hard fall, the stock for Akamai Technologies (AKAM) has accumulated and started to rise again.
Position: N/A
| When this high flying IPO came out in 1999 it climbed as high as $345.00 and within three years sunk to a low of 0.56 cents. That was a hard drop for many who were caught with their pants down. The dumping was fast and furious all the way down to the $2.00 - $3.00 area where the accumulation began. |
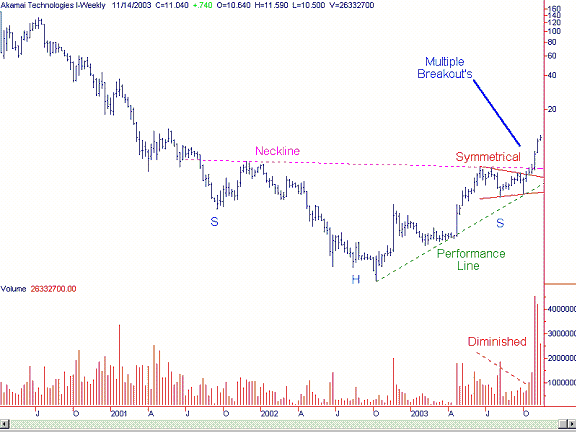
| On Akamai's weekly chart a 26-month bottom reversal head and shoulders pattern has emerged. The volume on this pattern is excellent. There is large dumping on the way down towards the base of the head where it finally bottoms with low volume trading. Of course, light volume on this equity was considered fewer than one million shares per day in July to November of 2002. The entry point for this equity came in the $3.75 - $4.00 area in August 2003 when the volume increased and it jumped off the bottom line. A second opportunity appeared when it touched the performance line in October while creating the small symmetrical triangle. |

|
| Figure 1: Weekly chart for AKAM. |
| Graphic provided by: SuperCharts. |
| |
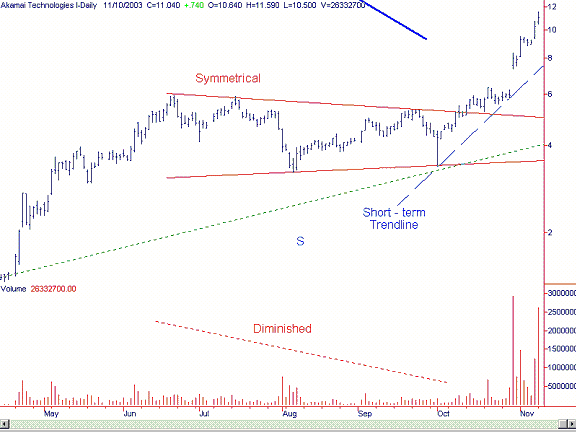
 Figure 2: Daily chart for AKAM. The symmetrical triangle took four months to create and then a high volume breakout occurred in the $5.00 - $6.00 area in October. There was hesitation at the neckline in the $6.00 area before the inevitable move higher. The next move came on humongous volume. If I were long on this equity I would watch the short-term trendline. When this trendline breaks it will be the appropriate time to lock in profits. This equity will move much higher in the medium-term but it is inevitable that it will take a breather and throw back towards the neckline. My guess is this will be in the $7.00 area and it will present a good opportunity to take a long position. Naturally, if it doesn't throw back I will look for other opportunities. |
Classic Dow Theorist who trades as a pure technician, using pattern recognition.
| Toronto, Canada |
Click here for more information about our publications!
PRINT THIS ARTICLE

Request Information From Our Sponsors
- VectorVest, Inc.
- Executive Premier Workshop
- One-Day Options Course
- OptionsPro
- Retirement Income Workshop
- Sure-Fire Trading Systems (VectorVest, Inc.)
- Trading as a Business Workshop
- VectorVest 7 EOD
- VectorVest 7 RealTime/IntraDay
- VectorVest AutoTester
- VectorVest Educational Services
- VectorVest OnLine
- VectorVest Options Analyzer
- VectorVest ProGraphics v6.0
- VectorVest ProTrader 7
- VectorVest RealTime Derby Tool
- VectorVest Simulator
- VectorVest Variator
- VectorVest Watchdog
- StockCharts.com, Inc.
- Candle Patterns
- Candlestick Charting Explained
- Intermarket Technical Analysis
- John Murphy on Chart Analysis
- John Murphy's Chart Pattern Recognition
- John Murphy's Market Message
- MurphyExplainsMarketAnalysis-Intermarket Analysis
- MurphyExplainsMarketAnalysis-Visual Analysis
- StockCharts.com
- Technical Analysis of the Financial Markets
- The Visual Investor
