HOT TOPICS LIST
- MACD
- Fibonacci
- RSI
- Gann
- ADXR
- Stochastics
- Volume
- Triangles
- Futures
- Cycles
- Volatility
- ZIGZAG
- MESA
- Retracement
- Aroon
INDICATORS LIST
LIST OF TOPICS
PRINT THIS ARTICLE
by Gary Grosschadl
KLAC is engaged in process monitoring systems for the semiconductor industry. They look ready to head higher.
Position: Buy
Gary Grosschadl
Independent Canadian equities trader and technical analyst based in Peterborough
Ontario, Canada.
PRINT THIS ARTICLE
BREAKOUTS
KLA - Tencor Corp. Poised For Breakout
11/10/03 08:46:27 AMby Gary Grosschadl
KLAC is engaged in process monitoring systems for the semiconductor industry. They look ready to head higher.
Position: Buy
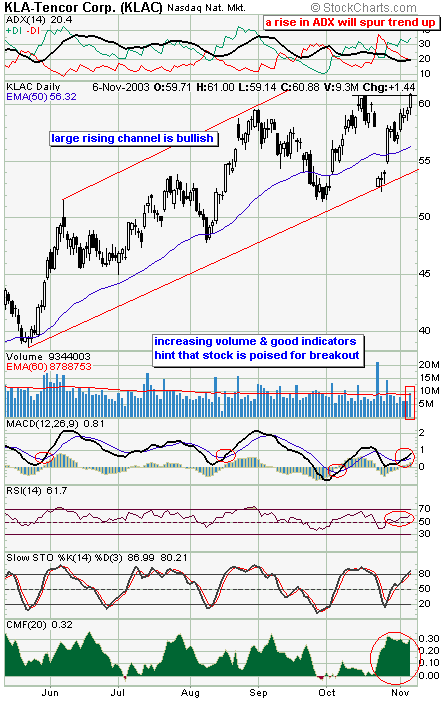
| This daily chart shows a bullish stock rising in a large uptrending channel. In the last two weeks the stock has made a very bullish bounce off the lower trendline and has now closed just above a previous high on expanding volume. The stock looks poised for an immediate breakout. |
| Let's examine several indicators to support this bullish premise. The trend strength indicator at the top of the chart shows a recent bullish DI crossover which coincided with the recent big advance. The strength component via the ADX line is just starting to rise and the ideal setup occurs when this ADX line is upsloping and between the DI lines with +DI (representing bullish power). From this stance, a rising ADX points to increasing bullish trend strength and this supports the breakout scenario. |

|
| KLAC's daily chart looks poised for a breakout. |
| Graphic provided by: stockcharts.com. |
| |
| The rising MACD (moving average convergence/divergence) and rising RSI (relative strength index) also show a bullish picture. Note how previous bullish crossovers for the MACD led to substantial price movement. RSI heading north of its 50 level is often a key sign of strength. The CMF or Chaiken Money Flow indicator also shows ample buying power and this indicator is often a reliable sign of buying or selling power. The only indicator waving a caution flag is stochastics which is heading into overbought territory. A turn back down through the 80 level could indicate a reversal when it occurs. |
| The stock looks poised to strike higher especially with the overall bullish bias the past two trading sessions for the main indexes. Watch for a high volume breakout in the next trading session and some bullish follow through to add weight to this breakout potential. |
Independent Canadian equities trader and technical analyst based in Peterborough
Ontario, Canada.
| Website: | www.whatsonsale.ca/financial.html |
| E-mail address: | gwg7@sympatico.ca |
Click here for more information about our publications!
PRINT THIS ARTICLE

|

Request Information From Our Sponsors
- StockCharts.com, Inc.
- Candle Patterns
- Candlestick Charting Explained
- Intermarket Technical Analysis
- John Murphy on Chart Analysis
- John Murphy's Chart Pattern Recognition
- John Murphy's Market Message
- MurphyExplainsMarketAnalysis-Intermarket Analysis
- MurphyExplainsMarketAnalysis-Visual Analysis
- StockCharts.com
- Technical Analysis of the Financial Markets
- The Visual Investor
- VectorVest, Inc.
- Executive Premier Workshop
- One-Day Options Course
- OptionsPro
- Retirement Income Workshop
- Sure-Fire Trading Systems (VectorVest, Inc.)
- Trading as a Business Workshop
- VectorVest 7 EOD
- VectorVest 7 RealTime/IntraDay
- VectorVest AutoTester
- VectorVest Educational Services
- VectorVest OnLine
- VectorVest Options Analyzer
- VectorVest ProGraphics v6.0
- VectorVest ProTrader 7
- VectorVest RealTime Derby Tool
- VectorVest Simulator
- VectorVest Variator
- VectorVest Watchdog
