HOT TOPICS LIST
- MACD
- Fibonacci
- RSI
- Gann
- ADXR
- Stochastics
- Volume
- Triangles
- Futures
- Cycles
- Volatility
- ZIGZAG
- MESA
- Retracement
- Aroon
INDICATORS LIST
LIST OF TOPICS
PRINT THIS ARTICLE
by Kevin Hopson
TransGlobe Energy has nearly quadrupled in price from its August low. Despite this, the stock looks attractive on a potential pull back to key support levels.
Position: Accumulate
Kevin Hopson
Kevin has been a technical analyst for roughly 10 years now. Previously, Kevin owned his own business and acted as a registered investment advisor, specializing in energy. He was also a freelance oil analyst for Orient Trading Co., a commodity futures trading firm in Japan. Kevin is currently a freelance writer.
PRINT THIS ARTICLE
TECHNICAL ANALYSIS
TransGlobe Energy's Pitchfork Breakout
11/07/03 02:55:07 PMby Kevin Hopson
TransGlobe Energy has nearly quadrupled in price from its August low. Despite this, the stock looks attractive on a potential pull back to key support levels.
Position: Accumulate
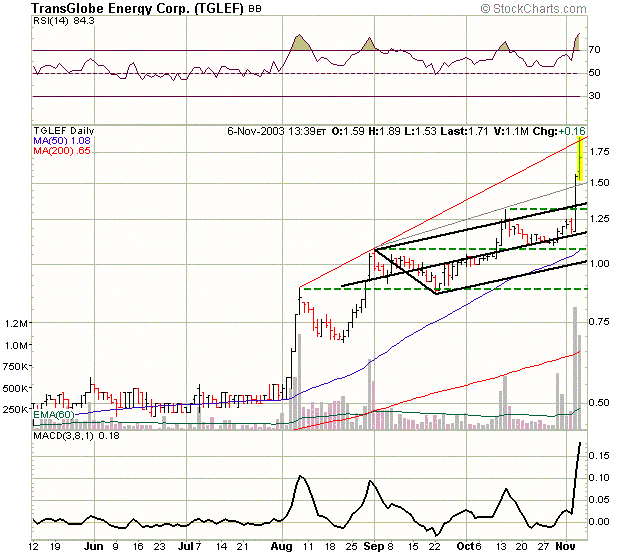
| I rarely touch on low-priced stocks but TransGlobe Energy (TGLEF) is one worth mentioning. I have followed this company for several years and management's hard work finally seems to be paying off. For example, not only did the company recently declare commercialization of a significant oil and gas interest in Yemen (Block S-1), but the company's stock will move from the Over-the-Counter (OTC) market to the American Stock Exchange (AMEX) starting November 10. Just to note, the new ticker symbol will be TGA. |
| The slew of good news has led to a significant increase in the stock price, with TransGlobe recently breaking out of two-month pitchfork configuration. This is illustrated in the six-month chart. Fortunately (for those who missed the boat), the indicators are reaching extremely overbought levels right now and the stock is finding resistance around the red uptrend line (top of its rising channel formation), which could signal a short-term pull back in the stock price. If so, there are three main support levels to consider buying at. The first is the $1.50 level, site of the gray trend line. Since this was prior resistance and broken resistance often turns into support, the $1.50 level should act as a good bouncing point for the stock. |

|
| Graphic provided by: Stockcharts.com. |
| |
| If prices proceed to pull back from here, the $1.30 to $1.35 range would be the most opportune place to buy. This is site of the recent double top breakout, the top black parallel line and the 38.2 percent retracement level from the August-November rally. Given the confluence of support here, the $1.30 to $1.35 range should be considered a significant buy area. Also, notice how TransGlobe successfully tested the past two double top breakout points (dotted green lines). In other words, the stock found support at prior resistance levels. If this pattern stays true to form, the recent double top breakout point ($1.30) should also act as support. |
| The ultimate downside target, should prices drop even further, would likely be the $1.20 level. Not only is this the site of the black median line, but it is also the site of August's uptrend line (now shown in the chart due to too much clutter). August's uptrend line is also the bottom of the rising channel formation. As a result, ultimate support will likely be found here, assuming prices dip this far. In any event, I would look to accumulate shares of TransGlobe Energy on a potential pull back to any (or all) of these support levels. |
Kevin has been a technical analyst for roughly 10 years now. Previously, Kevin owned his own business and acted as a registered investment advisor, specializing in energy. He was also a freelance oil analyst for Orient Trading Co., a commodity futures trading firm in Japan. Kevin is currently a freelance writer.
| Glen Allen, VA | |
| E-mail address: | hopson_1@yahoo.com |
Click here for more information about our publications!
PRINT THIS ARTICLE

|

Request Information From Our Sponsors
- StockCharts.com, Inc.
- Candle Patterns
- Candlestick Charting Explained
- Intermarket Technical Analysis
- John Murphy on Chart Analysis
- John Murphy's Chart Pattern Recognition
- John Murphy's Market Message
- MurphyExplainsMarketAnalysis-Intermarket Analysis
- MurphyExplainsMarketAnalysis-Visual Analysis
- StockCharts.com
- Technical Analysis of the Financial Markets
- The Visual Investor
- VectorVest, Inc.
- Executive Premier Workshop
- One-Day Options Course
- OptionsPro
- Retirement Income Workshop
- Sure-Fire Trading Systems (VectorVest, Inc.)
- Trading as a Business Workshop
- VectorVest 7 EOD
- VectorVest 7 RealTime/IntraDay
- VectorVest AutoTester
- VectorVest Educational Services
- VectorVest OnLine
- VectorVest Options Analyzer
- VectorVest ProGraphics v6.0
- VectorVest ProTrader 7
- VectorVest RealTime Derby Tool
- VectorVest Simulator
- VectorVest Variator
- VectorVest Watchdog
