HOT TOPICS LIST
- MACD
- Fibonacci
- RSI
- Gann
- ADXR
- Stochastics
- Volume
- Triangles
- Futures
- Cycles
- Volatility
- ZIGZAG
- MESA
- Retracement
- Aroon
INDICATORS LIST
LIST OF TOPICS
PRINT THIS ARTICLE
by Gary Grosschadl
Several negative developments shown on this chart hint at the liklihood of a downside test coming soon.
Position: Hold
Gary Grosschadl
Independent Canadian equities trader and technical analyst based in Peterborough
Ontario, Canada.
PRINT THIS ARTICLE
CHART ANALYSIS
Methanex Corp. Shows Early Warning Signs
11/06/03 09:13:39 AMby Gary Grosschadl
Several negative developments shown on this chart hint at the liklihood of a downside test coming soon.
Position: Hold
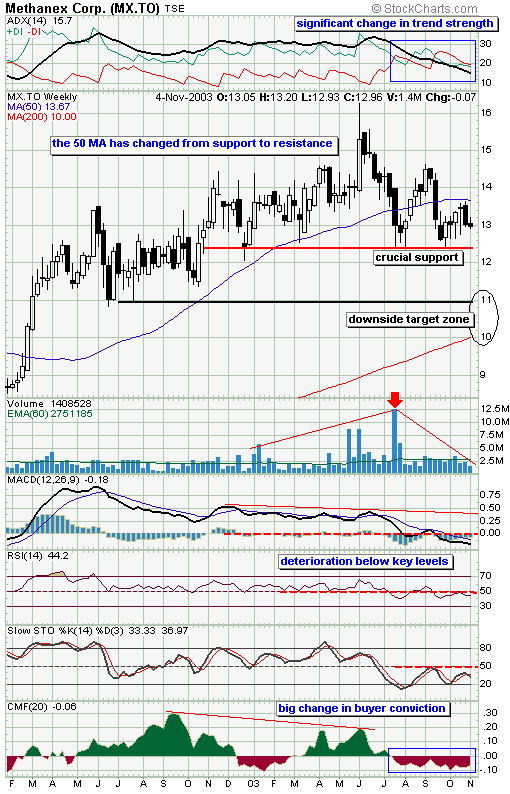
| The stock is currently above a critical support level although it is likely that this support level will be broken. A move below the $12.40 support level will confirm a sell notion. |
| This weekly chart shows that in early 2002, a strong uptrend developed as Methanex (world's largest supplier of methanol) charged through its 50-period moving average. The stock proceeded to rise from $9.50 to $16 while enjoying excellent support at this 50 MA. |

|
| Methanex weekly chart suggesting coming support test. |
| Graphic provided by: stockcharts.com. |
| |
| The first sign that this party may be over came with a plunge below the 50 ma on record volume of 12.5 milion shares. The bulls did manage to move the stock back up for several weeks but volume conviction was lacking. |
| With mounting evidence of multiple negative divergences showing on the displayed indicators, the stock soon fell below the 50 ma once again. Now the stock is boxed in between overhead moving average resistance and its support level established at $12.40. This support level could be likened to the neckline of a head and shoulders pattern as some might be tempted to call such a pattern. |
| The mathematical indicators displayed all paint a grim picture. They all show signs of key deterioration. At the top of the chart, trend strength has dramatically changed with the ADX line plunging and the DI lines crossing. The MACD graph (moving average convergence/divergence) now shows a move below the 0 line. Likewise the RSI (relative strength index) and stochastics also have moved below the 50 level (often a turning point). Finally the CMF (Chaiken Money Flow) indicator shows a distinct shift from buying pressure to selling pressure. All this evidence suggests that a support test is coming and failure there brings a proposed downside target between previous support of $11 and strong 200-period moving average support pegged at $10. |
Independent Canadian equities trader and technical analyst based in Peterborough
Ontario, Canada.
| Website: | www.whatsonsale.ca/financial.html |
| E-mail address: | gwg7@sympatico.ca |
Click here for more information about our publications!
PRINT THIS ARTICLE

Request Information From Our Sponsors
- VectorVest, Inc.
- Executive Premier Workshop
- One-Day Options Course
- OptionsPro
- Retirement Income Workshop
- Sure-Fire Trading Systems (VectorVest, Inc.)
- Trading as a Business Workshop
- VectorVest 7 EOD
- VectorVest 7 RealTime/IntraDay
- VectorVest AutoTester
- VectorVest Educational Services
- VectorVest OnLine
- VectorVest Options Analyzer
- VectorVest ProGraphics v6.0
- VectorVest ProTrader 7
- VectorVest RealTime Derby Tool
- VectorVest Simulator
- VectorVest Variator
- VectorVest Watchdog
- StockCharts.com, Inc.
- Candle Patterns
- Candlestick Charting Explained
- Intermarket Technical Analysis
- John Murphy on Chart Analysis
- John Murphy's Chart Pattern Recognition
- John Murphy's Market Message
- MurphyExplainsMarketAnalysis-Intermarket Analysis
- MurphyExplainsMarketAnalysis-Visual Analysis
- StockCharts.com
- Technical Analysis of the Financial Markets
- The Visual Investor
