HOT TOPICS LIST
- MACD
- Fibonacci
- RSI
- Gann
- ADXR
- Stochastics
- Volume
- Triangles
- Futures
- Cycles
- Volatility
- ZIGZAG
- MESA
- Retracement
- Aroon
INDICATORS LIST
LIST OF TOPICS
PRINT THIS ARTICLE
by Gary Grosschadl
This Canadian wireless play is showing early signs of weakness.
Position: Sell
Gary Grosschadl
Independent Canadian equities trader and technical analyst based in Peterborough
Ontario, Canada.
PRINT THIS ARTICLE
CHART ANALYSIS
Sierra Wireless (SW.to) Looking Weak
11/05/03 11:21:56 AMby Gary Grosschadl
This Canadian wireless play is showing early signs of weakness.
Position: Sell
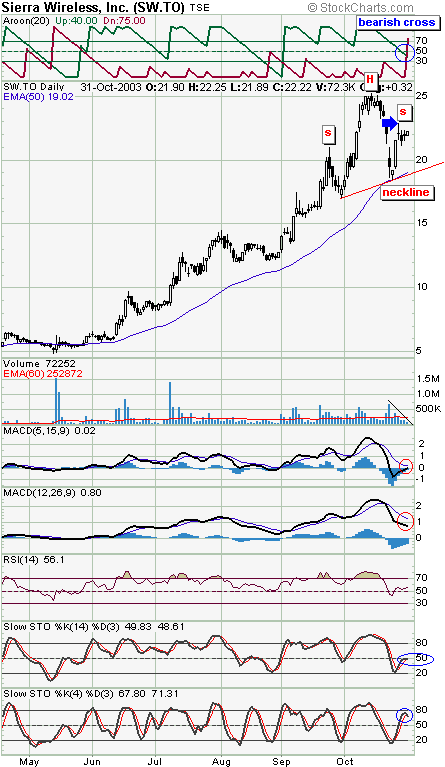
| The pattern on this daily chart is suggestive of a possible head and shoulders top forming. If this is correct, then the top of the right shoulder has likely been made and several indications support this. The first being the probable doji top marked by the blue arrow. Doji candlesticks (resembling small crosses) often mark tops and bottoms as they represent hesitation or indecision between buyers and sellers. This usually means a loss of momentum in the previous run. A move above the doji negates this negative bias but until it does it remains a top warning. Note the low and declining volume of late showing a lack of bullish conviction. |
| The Aroon indicator at the top of the chart shows a bearish development. This indicator is another trend strength indicator similar to the directional movement indicator or DMI. Movements below the 50 level are deemed to represent that the current trend (up) has lost its momentum. I like to also see an actual cross of the uptrend (green) and the downtrend (red) lines to make a stronger case. This then adds credence to what the doji candlestick infers regarding a topping action or loss of bullish momentum. |

|
| Daily chart of Sierra Wireless showing a possible topping pattern. |
| Graphic provided by: stockcharts.com. |
| |
| Several indicators below the chart also show bearish implications. Both the MACD (moving average convergence/divergence) series (longer term and shorter term) show the MACD line being under the blue signal line. Placement under the signal line is bearish while above the signal line pertains to bullishness. Likewise both stochastic series have bearish overtones. The longer term stochastic shows a likely stall at the 50 level which is often a noteable turning point. The shorter term series shows a downturn from the near 80 level which adds credence to the 50 level stall mentioned above. With both of these stochastics turning here, a downleg is likely. |
| A surprise bullish move above the doji candlestick negates the bearish view, otherwise a downleg seems more likely given the current state of the displayed indicators. This may result in a test of the slanted neckline near the $19 level. Failure there could bring a more serious decline which by measurement (neckline to head) could result in another drop of $6 below the neckline. |
Independent Canadian equities trader and technical analyst based in Peterborough
Ontario, Canada.
| Website: | www.whatsonsale.ca/financial.html |
| E-mail address: | gwg7@sympatico.ca |
Click here for more information about our publications!
PRINT THIS ARTICLE

Request Information From Our Sponsors
- StockCharts.com, Inc.
- Candle Patterns
- Candlestick Charting Explained
- Intermarket Technical Analysis
- John Murphy on Chart Analysis
- John Murphy's Chart Pattern Recognition
- John Murphy's Market Message
- MurphyExplainsMarketAnalysis-Intermarket Analysis
- MurphyExplainsMarketAnalysis-Visual Analysis
- StockCharts.com
- Technical Analysis of the Financial Markets
- The Visual Investor
- VectorVest, Inc.
- Executive Premier Workshop
- One-Day Options Course
- OptionsPro
- Retirement Income Workshop
- Sure-Fire Trading Systems (VectorVest, Inc.)
- Trading as a Business Workshop
- VectorVest 7 EOD
- VectorVest 7 RealTime/IntraDay
- VectorVest AutoTester
- VectorVest Educational Services
- VectorVest OnLine
- VectorVest Options Analyzer
- VectorVest ProGraphics v6.0
- VectorVest ProTrader 7
- VectorVest RealTime Derby Tool
- VectorVest Simulator
- VectorVest Variator
- VectorVest Watchdog
