HOT TOPICS LIST
- MACD
- Fibonacci
- RSI
- Gann
- ADXR
- Stochastics
- Volume
- Triangles
- Futures
- Cycles
- Volatility
- ZIGZAG
- MESA
- Retracement
- Aroon
INDICATORS LIST
LIST OF TOPICS
PRINT THIS ARTICLE
by Gary Grosschadl
Negative divergences may drive this index down again.
Position: Sell
Gary Grosschadl
Independent Canadian equities trader and technical analyst based in Peterborough
Ontario, Canada.
PRINT THIS ARTICLE
DOUBLE TOPS
Nasdaq Presents Possible Double Top
11/02/03 07:13:14 PMby Gary Grosschadl
Negative divergences may drive this index down again.
Position: Sell
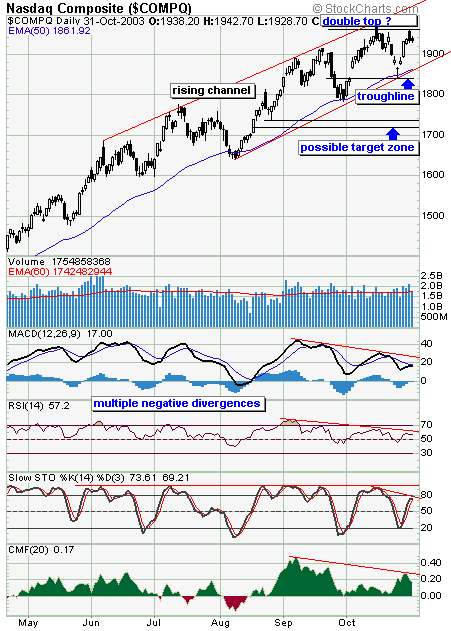
| The daily chart shows a recent problem returning, being another possible downleg driven by multiple negative divergences. This time it also looks like a possible double top attempt. |
| Several weeks ago this index hit a high which was short lived. The negative divergences, as displayed by the indicators shown, accurately foretold a coming downleg. The downleg was ended by a doji candlestick occurring at the 50 EMA (exponential moving average). |

|
| Daily Nasdaq chart showing downside implications. |
| Graphic provided by: stockcharts.com. |
| |
| Now we have a similar situation with these same negative divergences still being present. The implication is more serious this time as a possible double top is inferred. A move down to test the troughline at 1840 would determine if this indeed is to be a true double top. If this troughline is violated, then the double top looks to be fulfilled by a measured move (down) equal to the distance from the top to the troughline and then applied an equal distance below this same line. This would be a move down of 120 points to 1720. Since a previous bottom hammer (last August) occured at a nearby mark of 1740, a target zone of 1720 - 1740 is suggested. |
| The chart also shows a bullish rising channel. The implication is that a smaller retracement that successfully tests the lower trendline and then bounces back up, keeps the previous uptrend intact. In this way, the action at the channel trendline will determine whether this possible coming retracement is just a normal dip in a strong uptrend or that the double top will fulfill to the steeper downside target. |
Independent Canadian equities trader and technical analyst based in Peterborough
Ontario, Canada.
| Website: | www.whatsonsale.ca/financial.html |
| E-mail address: | gwg7@sympatico.ca |
Click here for more information about our publications!
Comments
Date: 11/06/03Rank: 4Comment:

Request Information From Our Sponsors
- StockCharts.com, Inc.
- Candle Patterns
- Candlestick Charting Explained
- Intermarket Technical Analysis
- John Murphy on Chart Analysis
- John Murphy's Chart Pattern Recognition
- John Murphy's Market Message
- MurphyExplainsMarketAnalysis-Intermarket Analysis
- MurphyExplainsMarketAnalysis-Visual Analysis
- StockCharts.com
- Technical Analysis of the Financial Markets
- The Visual Investor
- VectorVest, Inc.
- Executive Premier Workshop
- One-Day Options Course
- OptionsPro
- Retirement Income Workshop
- Sure-Fire Trading Systems (VectorVest, Inc.)
- Trading as a Business Workshop
- VectorVest 7 EOD
- VectorVest 7 RealTime/IntraDay
- VectorVest AutoTester
- VectorVest Educational Services
- VectorVest OnLine
- VectorVest Options Analyzer
- VectorVest ProGraphics v6.0
- VectorVest ProTrader 7
- VectorVest RealTime Derby Tool
- VectorVest Simulator
- VectorVest Variator
- VectorVest Watchdog
