HOT TOPICS LIST
- MACD
- Fibonacci
- RSI
- Gann
- ADXR
- Stochastics
- Volume
- Triangles
- Futures
- Cycles
- Volatility
- ZIGZAG
- MESA
- Retracement
- Aroon
INDICATORS LIST
LIST OF TOPICS
PRINT THIS ARTICLE
by Kevin Hopson
Valero Energy (VLO) has broken to the upside from an ascending triangle formation, indicating the potential for higher prices in the near-term.
Position: Hold
Kevin Hopson
Kevin has been a technical analyst for roughly 10 years now. Previously, Kevin owned his own business and acted as a registered investment advisor, specializing in energy. He was also a freelance oil analyst for Orient Trading Co., a commodity futures trading firm in Japan. Kevin is currently a freelance writer.
PRINT THIS ARTICLE
ASCENDING TRIANGLES
Valero Energy's Ascending Triangle Breakout
11/03/03 01:12:42 PMby Kevin Hopson
Valero Energy (VLO) has broken to the upside from an ascending triangle formation, indicating the potential for higher prices in the near-term.
Position: Hold
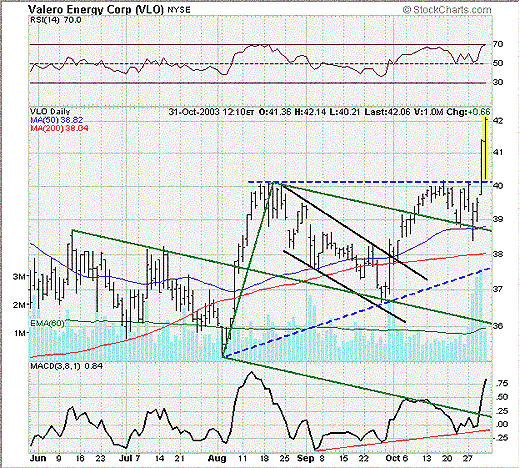
| I have touched on Valero Energy (VLO) two times in the last month. In late September, I mentioned how the stock appeared to be putting in a significant bottom. The reasons being that the green median line was coming into play, the stock was consolidating in a falling channel formation - which usually breaks to the upside - and the moving average convergence/divergence (MACD) was showing a bullish divergence on the daily chart. As expected, the stock bottomed out around the $37.00 level. In early October, I mentioned how the stock looked to be forming a bullish pennant after this bottom reversal occurred. As anticipated, Valero broke to the upside and proceeded to test a double top around the $40.00 level. |
| After testing the $40.00 level for the second time in two months, Valero temporarily pulled back, finding ultimate support along the top green parallel line and its 50-day moving average ($38.82). As you can see, the stock has now broken resistance at the $40.00 level, which happens to be the top of an ascending triangle formation dating back to mid-August. An ascending triangle is a pattern of flat (or horizontal) highs and higher lows, which is usually resolved by a break to the upside. As a result, such a move could have been anticipated by traders and investors alike. |

|
| Graphic provided by: Stockcharts.com. |
| |
| In any event, now that Valero has taken out significant resistance at the $40.00 level, the stock could see further price appreciation in the short-term. More specifically, if you measure the base of the triangle (from high to low), you get roughly $5.00 ($40.00 - $35.00). If you add this to the initial breakout point (roughly $40.00), you get a potential price target of $45.00 ($40.00 + $5.00). Being the case, I would continue to hold shares of Valero Energy, as there appears to be additional upside potential in the near-term. |
Kevin has been a technical analyst for roughly 10 years now. Previously, Kevin owned his own business and acted as a registered investment advisor, specializing in energy. He was also a freelance oil analyst for Orient Trading Co., a commodity futures trading firm in Japan. Kevin is currently a freelance writer.
| Glen Allen, VA | |
| E-mail address: | hopson_1@yahoo.com |
Click here for more information about our publications!
Comments
Date: 11/11/03Rank: 3Comment:

Request Information From Our Sponsors
- VectorVest, Inc.
- Executive Premier Workshop
- One-Day Options Course
- OptionsPro
- Retirement Income Workshop
- Sure-Fire Trading Systems (VectorVest, Inc.)
- Trading as a Business Workshop
- VectorVest 7 EOD
- VectorVest 7 RealTime/IntraDay
- VectorVest AutoTester
- VectorVest Educational Services
- VectorVest OnLine
- VectorVest Options Analyzer
- VectorVest ProGraphics v6.0
- VectorVest ProTrader 7
- VectorVest RealTime Derby Tool
- VectorVest Simulator
- VectorVest Variator
- VectorVest Watchdog
- StockCharts.com, Inc.
- Candle Patterns
- Candlestick Charting Explained
- Intermarket Technical Analysis
- John Murphy on Chart Analysis
- John Murphy's Chart Pattern Recognition
- John Murphy's Market Message
- MurphyExplainsMarketAnalysis-Intermarket Analysis
- MurphyExplainsMarketAnalysis-Visual Analysis
- StockCharts.com
- Technical Analysis of the Financial Markets
- The Visual Investor
