HOT TOPICS LIST
- MACD
- Fibonacci
- RSI
- Gann
- ADXR
- Stochastics
- Volume
- Triangles
- Futures
- Cycles
- Volatility
- ZIGZAG
- MESA
- Retracement
- Aroon
INDICATORS LIST
LIST OF TOPICS
PRINT THIS ARTICLE
by Matt Blackman
We had another spike last week in the ratio of insider shares sold to purchased. In this continuing story, I examine what these spikes may mean and whether this ratio be taken as a warning of a price change.
Position: N/A
Matt Blackman
Matt Blackman is a full-time technical and financial writer and trader. He produces corporate and financial newsletters, and assists clients in getting published in the mainstream media. He is the host of TradeSystemGuru.com. Matt has earned the Chartered Market Technician (CMT) designation. Find out what stocks and futures Matt is watching on Twitter at www.twitter.com/RatioTrade
PRINT THIS ARTICLE
INSIDE BUY/SELL
Insider Sales Update
11/03/03 09:29:28 AMby Matt Blackman
We had another spike last week in the ratio of insider shares sold to purchased. In this continuing story, I examine what these spikes may mean and whether this ratio be taken as a warning of a price change.
Position: N/A
| Weekly insider shares sales to purchases have been used by a number of analysts as a sentiment indicator of sorts. But I am unaware of any hard and fast index or indicator that, like the stochastic, relative strength index or commodity channel index, provides quantifiable threshold warning levels. In fact, other than calculating the ratios by hand every week with data provided by the Wall Street Journal or other publications, I have yet to discover a source of data for charting purposes that tracks insider sales and purchase activity over time. |
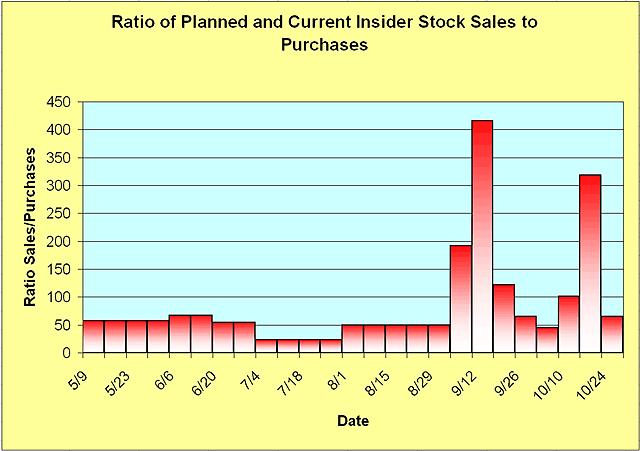
| To recap, the August level of approximately 60 shares sold or planned to be sold for every one purchased equaled value of $44 of shares sold for every dollar purchased, according to a report from Thomson Financial. Insider research analyst, Kevin Schwenger said in a September Wall Street Journal article that this represents the most bearish reading since comprehensive records began in 1990. That ratio then hit an incredible 415:1 in early September, which was followed by the most recent spike last week, dwarfing August figures. As mentioned in my last article, "Insider Sales Remain Brisk", exactly one week after it was reported that the ratio had jumped to 415 to 1, the S&P 500 dropped more than 4%. Five weeks later, the ratio spiked again to 319:1 for the week ending October 17. Over the next five days the S&P 500 Index dropped from a high of 1050 to a low of 1018 before recovering. |

|
| Figure 1 – Weekly chart showing changes in the ratio of insider shares sold and planned to be sold to those purchased. Note the most recent spike to 319:1 shares sold: purchased for the week ending October 17. Data provided by the Wall Street Journal. |
| |
| Total announced and planned shares sales were 1.038 billion versus 16.1 million shares purchased for the week ending October 24th, down from 1.054 billion sold to only 3.3 million purchased the previous week. Technology shares topped the list again with more than 208 million shares sold last week. Finance related stocks were next with 150 million shares being sold by insiders. Granted, there is no shortage of stocks that are up 200-300% from their March or October lows and the Nasdaq Composite Index is up nearly 40% from October so it is reasonable to assume that insiders will want to lock in some gains made during this period. However, levels of sales so far above historic norms can only cause one to wonder. If insiders are selling in record numbers why should I buy, especially given recent appreciations in value? SUGGESTED READING: Blackman, Matt [2003], "Insider Sales Tell A Troubling Tale," Traders.com Advantage, Sept 9/03 Blackman, Matt [2003], "Insider Stock Sales Continue To Soar," Traders.com Advantage, Sept 26/03. Blackman, Matt [2003], "Insider Selling Remains Brisk," Traders.com Advantage, October 21/03. |
Matt Blackman is a full-time technical and financial writer and trader. He produces corporate and financial newsletters, and assists clients in getting published in the mainstream media. He is the host of TradeSystemGuru.com. Matt has earned the Chartered Market Technician (CMT) designation. Find out what stocks and futures Matt is watching on Twitter at www.twitter.com/RatioTrade
| Company: | TradeSystemGuru.com |
| Address: | Box 2589 |
| Garibaldi Highlands, BC Canada | |
| Phone # for sales: | 604-898-9069 |
| Fax: | 604-898-9069 |
| Website: | www.tradesystemguru.com |
| E-mail address: | indextradermb@gmail.com |
Traders' Resource Links | |
| TradeSystemGuru.com has not added any product or service information to TRADERS' RESOURCE. | |
Click here for more information about our publications!
Comments
Date: 11/04/03Rank: 5Comment:
Date: 11/06/03Rank: 4Comment:

Request Information From Our Sponsors
- StockCharts.com, Inc.
- Candle Patterns
- Candlestick Charting Explained
- Intermarket Technical Analysis
- John Murphy on Chart Analysis
- John Murphy's Chart Pattern Recognition
- John Murphy's Market Message
- MurphyExplainsMarketAnalysis-Intermarket Analysis
- MurphyExplainsMarketAnalysis-Visual Analysis
- StockCharts.com
- Technical Analysis of the Financial Markets
- The Visual Investor
- VectorVest, Inc.
- Executive Premier Workshop
- One-Day Options Course
- OptionsPro
- Retirement Income Workshop
- Sure-Fire Trading Systems (VectorVest, Inc.)
- Trading as a Business Workshop
- VectorVest 7 EOD
- VectorVest 7 RealTime/IntraDay
- VectorVest AutoTester
- VectorVest Educational Services
- VectorVest OnLine
- VectorVest Options Analyzer
- VectorVest ProGraphics v6.0
- VectorVest ProTrader 7
- VectorVest RealTime Derby Tool
- VectorVest Simulator
- VectorVest Variator
- VectorVest Watchdog
