HOT TOPICS LIST
- MACD
- Fibonacci
- RSI
- Gann
- ADXR
- Stochastics
- Volume
- Triangles
- Futures
- Cycles
- Volatility
- ZIGZAG
- MESA
- Retracement
- Aroon
INDICATORS LIST
LIST OF TOPICS
PRINT THIS ARTICLE
by David Penn
Five-month long consolidations in cocoa and coffee look similar. Do they reflect bottoms, or lower prices still to come?
Position: N/A
David Penn
Technical Writer for Technical Analysis of STOCKS & COMMODITIES magazine, Working-Money.com, and Traders.com Advantage.
PRINT THIS ARTICLE
CONSOLID FORMATION
Sinking Sideways
11/04/03 08:29:12 AMby David Penn
Five-month long consolidations in cocoa and coffee look similar. Do they reflect bottoms, or lower prices still to come?
Position: N/A
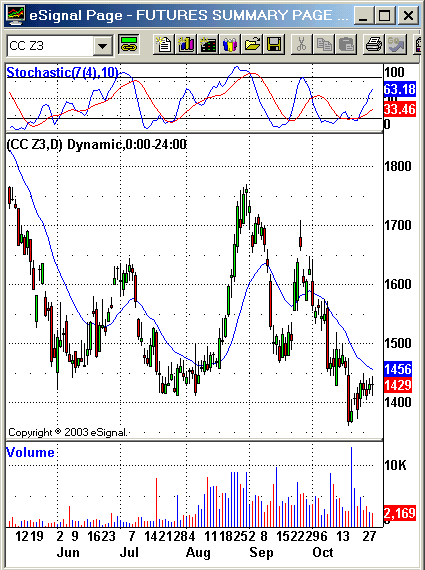
| Back in mid-October, I wrote a piece suggesting that the year-long correction in cocoa futures might be coming to an end ("December Cocoa's Comeback," Traders.com Advantage, October 14, 2003). In that discussion, I highlighted that the most recent leg of the correction (the August move down from about 1750, had yet to take out the lows of July at about 1410 (basis December). This, along with other factors, meant that there was a possibility that December cocoa might find support at the 1410 level and resume its bull market. |
| However, as the market moved into October, cocoa futures continued to move downward, breaking beneath the July lows by mid-month and setting a new contract low at 1360. While December cocoa has moved back up, the fact that the July lows were penetrated sets up the possibility that lower prices -- as opposed to higher prices -- may remain in the immediate future for cocoa. |

|
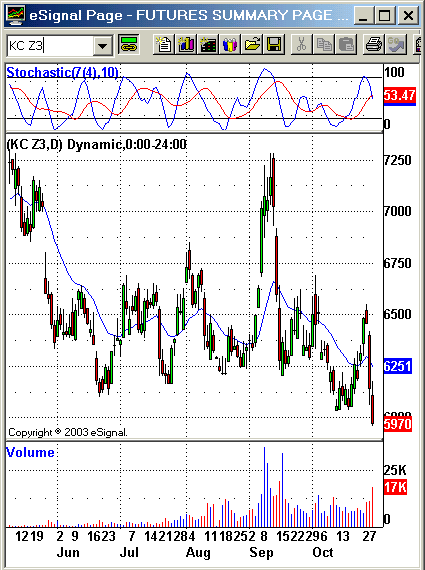
| Figure 1: December coffee appears to be breaking out of its months-long consolidation to the downside. |
| Graphic provided by: eSignal. |
| |
| Especially interesting about the developments in cocoa futures is that they significantly mirror the developments in coffee futures over the same time period. Cocoa futures moved into a more or less sideways consolidation in May, after falling several hundred points from its early February highs near 2290. Similarly, coffee futures, which had been drifting downward since the fall of 2002, leveled off mildly during the summer of 2003 and entered a sideways consolidation. |
| At present, what distinguishes cocoa from coffee is that coffee appears to have broken out from its months-long consolidation to the downside, whereas cocoa appears to be attempting to rally here in late October. This rally faces a real test when prices advance to the level of the 20-day exponential moving average, some thirty-odd points higher. Failure to rise above this level -- particularly given the high volume "up" day immediately following the day December cocoa made its contract low -- would be an ominously bearish signal from the cocoa market that its correction is not yet done. |
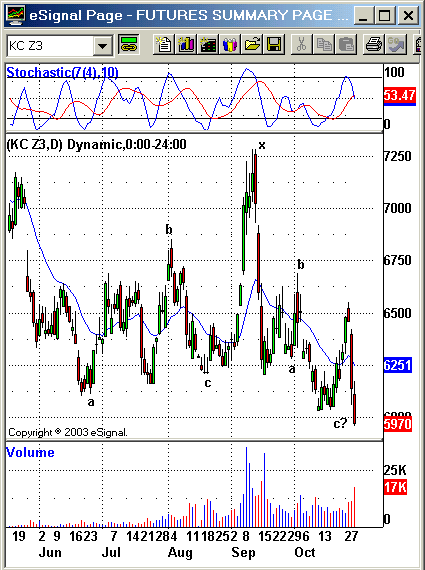
 Figure 2: Big volume near contract lows for December cocoa send prices toward a test of resistance at the 20-day exponential moving average. I couldn't help including an Elliott wave count in my last piece about December cocoa. Because of the new contract low set in October, that wave count became invalid (i.e., wave two cannot trace more than 100% of wave one). However, there is a reasonable argument, especially when both the cocoa and coffee charts are considered side-by-side, that what the two "softs" are experiencing in their five to six-month long sideways corrections are double three type corrections. Consider a double three correction-based labeling for December coffee:  Figure 3: Is December coffee slipping out of a double three consolidation on its way toward a final bottom? Should there in fact be a double three developing in coffee (and should the sideways movement in cocoa also prove to be a double three), then the "good" news is that both of these commodities are getting closer to real bottoms from which bull markets should emerge. Of course, the "bad" news is that both still appear to have some work to do on the downside before the bulls will be ready to run. |
Technical Writer for Technical Analysis of STOCKS & COMMODITIES magazine, Working-Money.com, and Traders.com Advantage.
| Title: | Technical Writer |
| Company: | Technical Analysis, Inc. |
| Address: | 4757 California Avenue SW |
| Seattle, WA 98116 | |
| Phone # for sales: | 206 938 0570 |
| Fax: | 206 938 1307 |
| Website: | www.Traders.com |
| E-mail address: | DPenn@traders.com |
Traders' Resource Links | |
| Charting the Stock Market: The Wyckoff Method -- Books | |
| Working-Money.com -- Online Trading Services | |
| Traders.com Advantage -- Online Trading Services | |
| Technical Analysis of Stocks & Commodities -- Publications and Newsletters | |
| Working Money, at Working-Money.com -- Publications and Newsletters | |
| Traders.com Advantage -- Publications and Newsletters | |
| Professional Traders Starter Kit -- Software | |
Click here for more information about our publications!
PRINT THIS ARTICLE

Request Information From Our Sponsors
- StockCharts.com, Inc.
- Candle Patterns
- Candlestick Charting Explained
- Intermarket Technical Analysis
- John Murphy on Chart Analysis
- John Murphy's Chart Pattern Recognition
- John Murphy's Market Message
- MurphyExplainsMarketAnalysis-Intermarket Analysis
- MurphyExplainsMarketAnalysis-Visual Analysis
- StockCharts.com
- Technical Analysis of the Financial Markets
- The Visual Investor
- VectorVest, Inc.
- Executive Premier Workshop
- One-Day Options Course
- OptionsPro
- Retirement Income Workshop
- Sure-Fire Trading Systems (VectorVest, Inc.)
- Trading as a Business Workshop
- VectorVest 7 EOD
- VectorVest 7 RealTime/IntraDay
- VectorVest AutoTester
- VectorVest Educational Services
- VectorVest OnLine
- VectorVest Options Analyzer
- VectorVest ProGraphics v6.0
- VectorVest ProTrader 7
- VectorVest RealTime Derby Tool
- VectorVest Simulator
- VectorVest Variator
- VectorVest Watchdog
