HOT TOPICS LIST
- MACD
- Fibonacci
- RSI
- Gann
- ADXR
- Stochastics
- Volume
- Triangles
- Futures
- Cycles
- Volatility
- ZIGZAG
- MESA
- Retracement
- Aroon
INDICATORS LIST
LIST OF TOPICS
PRINT THIS ARTICLE
by David Penn
When an intraday breakdown failed to take place, semiconductor stocks roared back to the upside.
Position: N/A
David Penn
Technical Writer for Technical Analysis of STOCKS & COMMODITIES magazine, Working-Money.com, and Traders.com Advantage.
PRINT THIS ARTICLE
FLAGS AND PENNANTS
Semiconductors: Sayonara, No! Konichiwa, Yes!
10/30/03 10:36:33 AMby David Penn
When an intraday breakdown failed to take place, semiconductor stocks roared back to the upside.
Position: N/A
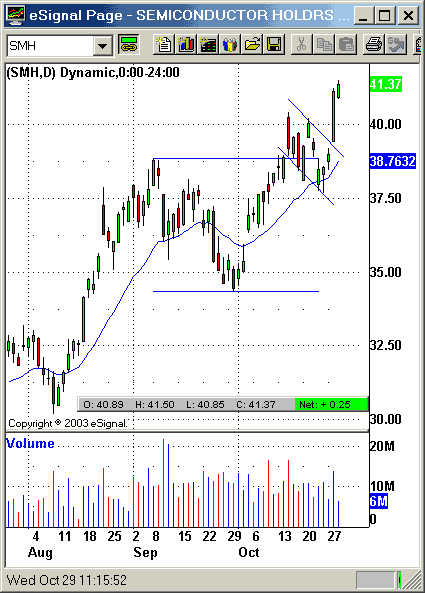
| About one month ago to the day I posted a Traders.com Advantage article suggesting that, based on an intraday head and shoulders pattern in the semiconductor HOLDRs, SMH, semiconductor stocks appeared on the verge of correction. I didn't believe this correction would be especially steep, but it did appear that semiconductor stocks, which per the SMH had rallied from under $31 to just shy of $39 from mid-August to mid-September, were due for a breather. |
| Apparently the semiconductor stocks don't subscribe to Traders.com Advantage. Although the SMH broke down beneath the neckline support at about $36, they only fell to an intraday low of $34.30 (I had suggested a downside of just north of $33.). This intraday low proved to be a significant pivot point as the SMH rallied strongly from these levels, taking out the old September high at $38.85 in a mid-October breakout. |

|
| This bullish flag formation that developed in mid-October was a sign that semiconductor stocks were headed higher. |
| Graphic provided by: eSignal. |
| |
| What is especially interesting about the semiconductors here (the performance of which suggests that the market is more likely to move higher than lower over the next few weeks), is the way they briefly consolidated during the middle part of October. Dipping only slightly below the breakout level of $38.85 (SMH slipped as low as about $37.50) in nine days of sideways-to-lower trading, the SMH developed a flag-like formation that signaled to alert traders and investors that the breakout the semiconductors achieved in early October was for real. |
| A flag formation consists of short-term, countertrend price action that is bounded by two parallel trendlines. The emphasis is on short-term: flags tend to develop over a matter of days, as opposed to weeks, and thus often appear as the only possible consolidation in a market that is strongly moving up in a short period of time. |
| Here, the SMH has already broken out from its mid-October flag, and is moving strongly higher. How high will it go? The basic measurement rule for flag formations is to take the value from the start of the trend to the beginning of the formation, and to add that value to the value at the breakout point. In this case, a value of about 4.5 (trend to beginning of formation) would be added to the value at the breakout of about 39.50 for a sum of 44, the next likely destination for the semiconductor HOLDRs. |
Technical Writer for Technical Analysis of STOCKS & COMMODITIES magazine, Working-Money.com, and Traders.com Advantage.
| Title: | Technical Writer |
| Company: | Technical Analysis, Inc. |
| Address: | 4757 California Avenue SW |
| Seattle, WA 98116 | |
| Phone # for sales: | 206 938 0570 |
| Fax: | 206 938 1307 |
| Website: | www.Traders.com |
| E-mail address: | DPenn@traders.com |
Traders' Resource Links | |
| Charting the Stock Market: The Wyckoff Method -- Books | |
| Working-Money.com -- Online Trading Services | |
| Traders.com Advantage -- Online Trading Services | |
| Technical Analysis of Stocks & Commodities -- Publications and Newsletters | |
| Working Money, at Working-Money.com -- Publications and Newsletters | |
| Traders.com Advantage -- Publications and Newsletters | |
| Professional Traders Starter Kit -- Software | |
Click here for more information about our publications!
PRINT THIS ARTICLE

Request Information From Our Sponsors
- StockCharts.com, Inc.
- Candle Patterns
- Candlestick Charting Explained
- Intermarket Technical Analysis
- John Murphy on Chart Analysis
- John Murphy's Chart Pattern Recognition
- John Murphy's Market Message
- MurphyExplainsMarketAnalysis-Intermarket Analysis
- MurphyExplainsMarketAnalysis-Visual Analysis
- StockCharts.com
- Technical Analysis of the Financial Markets
- The Visual Investor
- VectorVest, Inc.
- Executive Premier Workshop
- One-Day Options Course
- OptionsPro
- Retirement Income Workshop
- Sure-Fire Trading Systems (VectorVest, Inc.)
- Trading as a Business Workshop
- VectorVest 7 EOD
- VectorVest 7 RealTime/IntraDay
- VectorVest AutoTester
- VectorVest Educational Services
- VectorVest OnLine
- VectorVest Options Analyzer
- VectorVest ProGraphics v6.0
- VectorVest ProTrader 7
- VectorVest RealTime Derby Tool
- VectorVest Simulator
- VectorVest Variator
- VectorVest Watchdog
