HOT TOPICS LIST
- MACD
- Fibonacci
- RSI
- Gann
- ADXR
- Stochastics
- Volume
- Triangles
- Futures
- Cycles
- Volatility
- ZIGZAG
- MESA
- Retracement
- Aroon
INDICATORS LIST
LIST OF TOPICS
PRINT THIS ARTICLE
by David Penn
Having broken down from above $30 highs in September, December crude breaks down again in late October.
Position: N/A
David Penn
Technical Writer for Technical Analysis of STOCKS & COMMODITIES magazine, Working-Money.com, and Traders.com Advantage.
PRINT THIS ARTICLE
HEAD & SHOULDERS
Crude Oil Finally Cracks (Again)
10/30/03 08:38:42 AMby David Penn
Having broken down from above $30 highs in September, December crude breaks down again in late October.
Position: N/A
| Back in early September, I warned that crude oil futures, which had fallen from above $31 (basis December), were ripe for -- at a minimum -- a bounce. At the time, December crude was trading at about $28.50 and the bounce I believed might take place could take prices back up a dollar or two to the $30 area. |
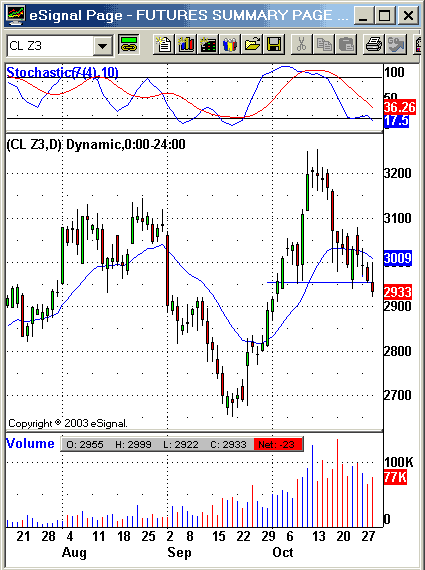
| As it turned out, crude oil did bounce ten calendar days after "Crude Oil Finally Cracks" was posted at Traders.com Advantage. December crude fell as low as $26.50 on an intraday basis before bouncing and, in fact, rallying strongly over the balance of September and into October, taking out the August highs just shy of $31.50 and finally peaking just above $32.50 in mid-October. |

|
| Figure 1: After a sharp rally from mid-September to mid-October, December crude heads back down. |
| Graphic provided by: eSignal. |
| |
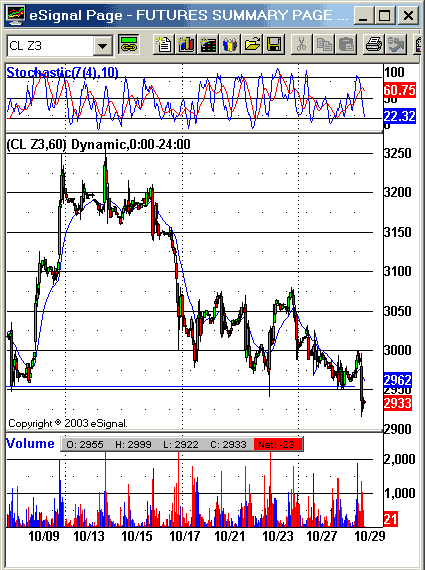
But this rally has also corrected. The force of nine out of eleven, above-average volume selling days drove December crude from its mid-month perch above $32 to a support area just north of $29. In fact a head and shoulders top may be developing out of the price action since late September. This head and shoulders top, especially clear in hourly charts of the December contract, threatens to send the futures deeply below their 20-day exponential moving average and perhaps as low as $26.50, where it might find support at the same level as did the previous significant decline in crude oil (the late August/early September collapse that was the subject of "Crude Oil Finally Cracks"). Figure 2: The head and right shoulder of the head and shoulders top that is developing in December crude are easy to see in this hourly chart. |
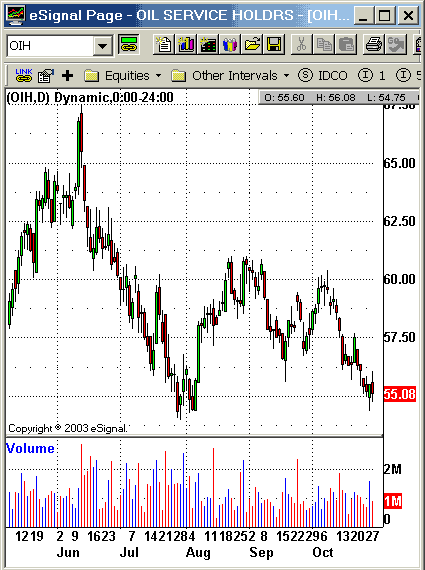
While there are a number of fundamental factors that support the case for higher oil prices: resurgent economic growth (especially in Asia), Middle Eastern tensions in Iraq... there are growing fundamental arguments against higher oil prices (The Economist recently featured a cover story titled "The End of the Oil Age"). Additionally, if the highs of August and October represent a top in crude oil prices for the time being, it would go a long way toward explaining the lackluster performance of so many oil service companies, which have lagged as oil prices roared upward in the fall. The fact that the oil services HOLDRs, OIH moved up strongly with crude oil's advance in the summer, but have underperformed as crude oil set an even higher high in the fall may be another bearish sign for the price of crude. Figure 3: Oil services companies, as represented by the oil service HOLDRs, OIH, have not performed as well in the fall--when crude reached $32.50--as they did in the summer--when crude oil rallied to $31.50. |
Technical Writer for Technical Analysis of STOCKS & COMMODITIES magazine, Working-Money.com, and Traders.com Advantage.
| Title: | Technical Writer |
| Company: | Technical Analysis, Inc. |
| Address: | 4757 California Avenue SW |
| Seattle, WA 98116 | |
| Phone # for sales: | 206 938 0570 |
| Fax: | 206 938 1307 |
| Website: | www.Traders.com |
| E-mail address: | DPenn@traders.com |
Traders' Resource Links | |
| Charting the Stock Market: The Wyckoff Method -- Books | |
| Working-Money.com -- Online Trading Services | |
| Traders.com Advantage -- Online Trading Services | |
| Technical Analysis of Stocks & Commodities -- Publications and Newsletters | |
| Working Money, at Working-Money.com -- Publications and Newsletters | |
| Traders.com Advantage -- Publications and Newsletters | |
| Professional Traders Starter Kit -- Software | |
Click here for more information about our publications!
Comments
Date: 11/06/03Rank: 4Comment:

|

Request Information From Our Sponsors
- VectorVest, Inc.
- Executive Premier Workshop
- One-Day Options Course
- OptionsPro
- Retirement Income Workshop
- Sure-Fire Trading Systems (VectorVest, Inc.)
- Trading as a Business Workshop
- VectorVest 7 EOD
- VectorVest 7 RealTime/IntraDay
- VectorVest AutoTester
- VectorVest Educational Services
- VectorVest OnLine
- VectorVest Options Analyzer
- VectorVest ProGraphics v6.0
- VectorVest ProTrader 7
- VectorVest RealTime Derby Tool
- VectorVest Simulator
- VectorVest Variator
- VectorVest Watchdog
- StockCharts.com, Inc.
- Candle Patterns
- Candlestick Charting Explained
- Intermarket Technical Analysis
- John Murphy on Chart Analysis
- John Murphy's Chart Pattern Recognition
- John Murphy's Market Message
- MurphyExplainsMarketAnalysis-Intermarket Analysis
- MurphyExplainsMarketAnalysis-Visual Analysis
- StockCharts.com
- Technical Analysis of the Financial Markets
- The Visual Investor
