HOT TOPICS LIST
- MACD
- Fibonacci
- RSI
- Gann
- ADXR
- Stochastics
- Volume
- Triangles
- Futures
- Cycles
- Volatility
- ZIGZAG
- MESA
- Retracement
- Aroon
INDICATORS LIST
LIST OF TOPICS
PRINT THIS ARTICLE
by David Penn
An eight-hour consolidation in the S&P 500 helped the market resume its bullish ways.
Position: N/A
David Penn
Technical Writer for Technical Analysis of STOCKS & COMMODITIES magazine, Working-Money.com, and Traders.com Advantage.
PRINT THIS ARTICLE
FLAGS AND PENNANTS
The S&P 500's Intraday Pennant
10/30/03 08:04:45 AMby David Penn
An eight-hour consolidation in the S&P 500 helped the market resume its bullish ways.
Position: N/A
| With consolidations like these, who needs Alan Greenspan? Those watching the S&P 500 on an intermediate, intraday basis (i.e., hourly charts) have noted, perhaps in horror, as the market's late September to mid-October advance peaked just north of 1050 and began to move down. Many bearish observers and commentators, hoping that October -- as it so often has -- would bring the market to its knees, saw in these mid-month declines the beginnings of the bitter (if long-awaited for) end. And as the S&P 500 dropped and dropped again toward 1020, these bears appeared to be carrying the day. |
| But as has been the case so many times in this cyclical bull market that began in March 2003 (or October 2002 for the Nasdaq), the bullish sentiment proved overwhelming. The first indication that the bulls were far from done in came late on Friday, October 24th, when the S&P 500, which had been trading near its lows for the week, suddenly saw a flurry of buying that drove the market from just under 1020 to just over 1028. This strong close to finish the week was a signal that the market may have bottomed. The long lower tail on the daily chart of the S&P 500 for October 24th was another indication. |

|
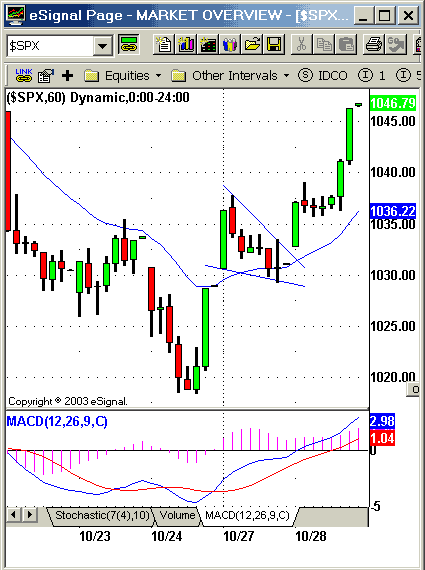
| This bullish pennant set the stage for further gains as the S&P 500 rallied from the lows of the previous week. |
| Graphic provided by: eSignal. |
| |
| On Monday the 27th, the market opened strongly, even if it faded somewhat over the course of the day. However, this "fade" was not any ordinary correction; in fact, the fade took the shape of a bullish pennant, a chart pattern that suggested strongly that the bullishness of Friday was quite likely for real and the slight weakness on Monday, merely a buying opportunity. |
| The pennant, as Thomas Bulkowski describes it in his book, Encyclopedia of Chart Patterns, consists of a downwardly sloping triangle-shaped consolidation that is bound by two converging trendlines. The pennant is very much like the flag formation; the flag differing from the pennant by having two parallel trendlines instead of converging ones. Pennants often occur in fast-moving markets, and provide a brief "accumulation/distribution" zone for new buyers to enter the market and for old buyers to exit. Bulkowski suggests measuring the likely continuation by taking the distance from the beginning of the market move to the start of the pennant, and adding that value to the value at the point at which prices break free from the pennant. |
| In the case of the S&P 500 provided here, the pre-pennant market move was approximately 12 points (1018 to 1030). The breakout from the pennant occurred at 1033. Thus, the S&P 500 could be expected to move to around 1045 in an initial move up. Interestingly, that is exactly what the market did before the closing bell rang on Tuesday, ending the day at approximately 1046.79. |
Technical Writer for Technical Analysis of STOCKS & COMMODITIES magazine, Working-Money.com, and Traders.com Advantage.
| Title: | Technical Writer |
| Company: | Technical Analysis, Inc. |
| Address: | 4757 California Avenue SW |
| Seattle, WA 98116 | |
| Phone # for sales: | 206 938 0570 |
| Fax: | 206 938 1307 |
| Website: | www.Traders.com |
| E-mail address: | DPenn@traders.com |
Traders' Resource Links | |
| Charting the Stock Market: The Wyckoff Method -- Books | |
| Working-Money.com -- Online Trading Services | |
| Traders.com Advantage -- Online Trading Services | |
| Technical Analysis of Stocks & Commodities -- Publications and Newsletters | |
| Working Money, at Working-Money.com -- Publications and Newsletters | |
| Traders.com Advantage -- Publications and Newsletters | |
| Professional Traders Starter Kit -- Software | |
Click here for more information about our publications!
PRINT THIS ARTICLE

Request Information From Our Sponsors
- StockCharts.com, Inc.
- Candle Patterns
- Candlestick Charting Explained
- Intermarket Technical Analysis
- John Murphy on Chart Analysis
- John Murphy's Chart Pattern Recognition
- John Murphy's Market Message
- MurphyExplainsMarketAnalysis-Intermarket Analysis
- MurphyExplainsMarketAnalysis-Visual Analysis
- StockCharts.com
- Technical Analysis of the Financial Markets
- The Visual Investor
- VectorVest, Inc.
- Executive Premier Workshop
- One-Day Options Course
- OptionsPro
- Retirement Income Workshop
- Sure-Fire Trading Systems (VectorVest, Inc.)
- Trading as a Business Workshop
- VectorVest 7 EOD
- VectorVest 7 RealTime/IntraDay
- VectorVest AutoTester
- VectorVest Educational Services
- VectorVest OnLine
- VectorVest Options Analyzer
- VectorVest ProGraphics v6.0
- VectorVest ProTrader 7
- VectorVest RealTime Derby Tool
- VectorVest Simulator
- VectorVest Variator
- VectorVest Watchdog
