HOT TOPICS LIST
- MACD
- Fibonacci
- RSI
- Gann
- ADXR
- Stochastics
- Volume
- Triangles
- Futures
- Cycles
- Volatility
- ZIGZAG
- MESA
- Retracement
- Aroon
INDICATORS LIST
LIST OF TOPICS
PRINT THIS ARTICLE
by Koos van der Merwe
Its ticker is CHINA, and with all the news on China appearing in major publications over the past two weeks, is its wonderful ticker leading the share price?
Position: N/A
Koos van der Merwe
Has been a technical analyst since 1969, and has worked as a futures and options trader with First Financial Futures in Johannesburg, South Africa.
PRINT THIS ARTICLE
TRIANGLES
Chinadotcom Corporation
10/28/03 01:46:46 PMby Koos van der Merwe
Its ticker is CHINA, and with all the news on China appearing in major publications over the past two weeks, is its wonderful ticker leading the share price?
Position: N/A
| Chinadotcom Corporation is the leading pan-Asian Internet Company, providing a full range of Internet services throughout the Asia-Pacific region. Looking at their last balance sheet, total revenue was $59,300,000 (US$) with total assets of $580,950,000 and a loss of $11,570,000. This was for the December 2002 year end. For the end of the quarter June 30, 2003, it shows revenue of $ 21.9 million with a net income of $2.7 million, and an earnings of 0.04 per share. What does its chart say? |

|
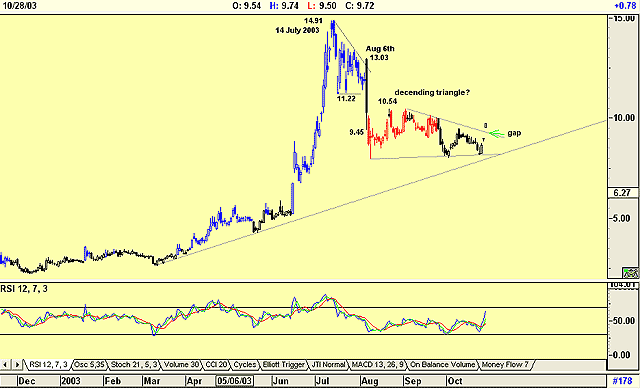
| Figure 1: Chinadotcom, a lesson in contradiction. |
| Graphic provided by: AdvancedGET. |
| |
| The chart shows a logarithmic post-bubble climb to reach a high of $14.94 on July 14, 2003. The angle of ascent alone would have warned of an impending favorable short position, and many bears would have gone short, covering their position at $11.22 when what appeared to be a double bottom formed. The share price rose and actually broke above the short-term trendline on August 6th before collapsing from $13.03 to $9.45, a drop of over 13%. Remarkably enough this drop occurred after the following report: HONG KONG, Aug. 6 /PRNewswire-FirstCall/ -- Chinadotcom corporation (Nasdaq: CHINA; Website: www.corp.china.com), a leading integrated enterprise software and solutions company in Asia, today announced its financial results for the second quarter of 2003 ending June 30th, 2003 under US GAAP. The company reported a 51% growth in sequential quarterly revenues in Q2 2003 from continuing operations, including new acquisitions, of US$21.9 million. Gross profit in Q2 2003 was US$9.6 million, up 89% from US$5.1 million in Q1 2003, while gross margin rose from 35% in Q1 2003 to 44% in Q2 2003. SG&A expense was US$8.1 million in Q2 2003 versus US$5.7 million in Q1 2003. US GAAP net income more than tripled to US$4.1 million for Q2 2003, up 211% versus Q1 2003. As of March 31, 2003, Chinadotcom had approximately 100 million common shares outstanding. Ch'ien continued, "At this time, the board and I feel confident in the company's diversification strategy of multiple high-margin, recurrent revenue businesses and believe the company is well poised for continued growth in the long-term." |
| So what caused this tremendous fall? I can only assume that it was the following statement: CHINA attributed its successful quarter to cutting cost, consolidating operations, and improving gross margins. The market wants to see an increase in sales, not an increase in profits, or perhaps it was the purchase of a company called Newpalm. Whatever the reason, on August 8th the company put out a bulletin to try and placate investors by answering any and all questions asked. This resulted in the share price gradually rising to $10.54. |
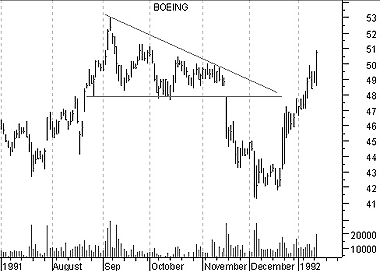
 Figure 2: A descending triangle formation in Chinadotcom. Since then, the share price has fallen to form what appears to be a descending triangle. Descending triangle have falling tops and a horizontal base. The movement into the triangle is from below and usually falls away to a turning point at its apex at a lower price level, as shown in the chart above. However, with Chinadotcom, the share price has broken upwards, and on a gap. Is this a sign that the company will have strong sales in the next quarter or is it pure speculation on the part of the investing public, and seeing the ticker CHINA? The RSI indicator is suggesting strength, but only time will tell. |
Has been a technical analyst since 1969, and has worked as a futures and options trader with First Financial Futures in Johannesburg, South Africa.
| Address: | 3256 West 24th Ave |
| Vancouver, BC | |
| Phone # for sales: | 6042634214 |
| E-mail address: | petroosp@gmail.com |
Click here for more information about our publications!
Comments
Date: 10/28/03Rank: 5Comment:

|

Request Information From Our Sponsors
- StockCharts.com, Inc.
- Candle Patterns
- Candlestick Charting Explained
- Intermarket Technical Analysis
- John Murphy on Chart Analysis
- John Murphy's Chart Pattern Recognition
- John Murphy's Market Message
- MurphyExplainsMarketAnalysis-Intermarket Analysis
- MurphyExplainsMarketAnalysis-Visual Analysis
- StockCharts.com
- Technical Analysis of the Financial Markets
- The Visual Investor
- VectorVest, Inc.
- Executive Premier Workshop
- One-Day Options Course
- OptionsPro
- Retirement Income Workshop
- Sure-Fire Trading Systems (VectorVest, Inc.)
- Trading as a Business Workshop
- VectorVest 7 EOD
- VectorVest 7 RealTime/IntraDay
- VectorVest AutoTester
- VectorVest Educational Services
- VectorVest OnLine
- VectorVest Options Analyzer
- VectorVest ProGraphics v6.0
- VectorVest ProTrader 7
- VectorVest RealTime Derby Tool
- VectorVest Simulator
- VectorVest Variator
- VectorVest Watchdog
