HOT TOPICS LIST
- MACD
- Fibonacci
- RSI
- Gann
- ADXR
- Stochastics
- Volume
- Triangles
- Futures
- Cycles
- Volatility
- ZIGZAG
- MESA
- Retracement
- Aroon
INDICATORS LIST
LIST OF TOPICS
PRINT THIS ARTICLE
by Kevin Hopson
Despite the recent pullback in the S&P 500, the index's long-term uptrend remains intact, meaning that investors should continue to hold.
Position: Hold
Kevin Hopson
Kevin has been a technical analyst for roughly 10 years now. Previously, Kevin owned his own business and acted as a registered investment advisor, specializing in energy. He was also a freelance oil analyst for Orient Trading Co., a commodity futures trading firm in Japan. Kevin is currently a freelance writer.
PRINT THIS ARTICLE
TECHNICAL ANALYSIS
Long-Term Uptrend Remains Intact For The S&P 500
10/28/03 02:11:21 PMby Kevin Hopson
Despite the recent pullback in the S&P 500, the index's long-term uptrend remains intact, meaning that investors should continue to hold.
Position: Hold
| The last time I touched on the S&P 500 Large-Cap Index (SPX), I mentioned how the index had broken out of a two and a half month trading range, thus signaling higher prices in the short-term. More specifically, the trading range breakout indicated a potential upside target between 1125 and 1180. As expected, the index has continued to move higher. While the recent pullback may have scared some investors into selling, the long-term uptrend remains intact. |
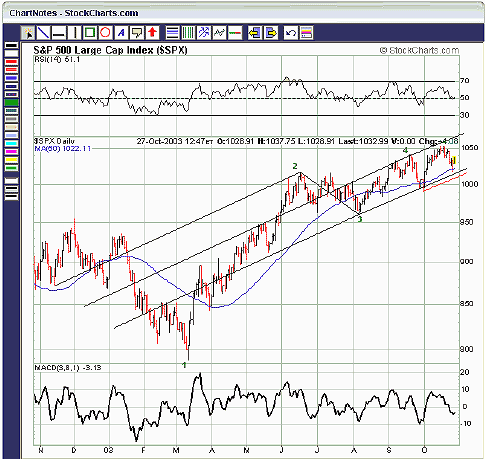
| For example, if you look at the one-year chart for the SPX, you will notice that a key uptrend line recently came into play. However, for those of you unfamiliar with pitchfork analysis, I will explain the concept. Normally, pitchforks are drawn using three major pivot (or turning) points in price. More specifically, it uses a high-low-high combination or a low-high-low combination. When it is difficult to determine major turning points in price, a reverse pitchfork can be drawn instead. Since the SPX has been in a steep uptrend and corrections have been minimal up to this point, a reverse pitchfork can offer some much-needed insight on the strength of the trend. |

|
| Graphic provided by: Stockcharts.com. |
| |
| When drawing a reverse pitchfork, label the starting point of the trend as pivot 0. Then try to determine the next three significant turning points in price (pivots 2, 3 and 4). Once you have done this, draw a pitchfork using the 4-3-2 pivot points. Since the pitchfork will move from right to left, the opposite (or reverse) direction of a normal pitchfork, you extend the median line and bottom parallel line to the right to get a better feel for future price movement. As you can see in the chart, the SPX has been consolidating within the lower channel of the reverse pitchfork. |
| Though the SPX slightly breached the bottom parallel line in late September, pitchfork analysis allows for some margin of error. In other words, to give prices a second chance, we draw a red warning line from this low. You will notice that this warning line has yet to be broken, meaning that the long-term uptrend is still intact. However, should the index eventually breach support here (roughly the 1010 level right now), investors would be best suited to take profits. Until then, hold on for the ride and let your profits run. |
Kevin has been a technical analyst for roughly 10 years now. Previously, Kevin owned his own business and acted as a registered investment advisor, specializing in energy. He was also a freelance oil analyst for Orient Trading Co., a commodity futures trading firm in Japan. Kevin is currently a freelance writer.
| Glen Allen, VA | |
| E-mail address: | hopson_1@yahoo.com |
Click here for more information about our publications!
Comments
Date: 10/28/03Rank: 5Comment:
Date: 10/29/03Rank: 2Comment:

Request Information From Our Sponsors
- StockCharts.com, Inc.
- Candle Patterns
- Candlestick Charting Explained
- Intermarket Technical Analysis
- John Murphy on Chart Analysis
- John Murphy's Chart Pattern Recognition
- John Murphy's Market Message
- MurphyExplainsMarketAnalysis-Intermarket Analysis
- MurphyExplainsMarketAnalysis-Visual Analysis
- StockCharts.com
- Technical Analysis of the Financial Markets
- The Visual Investor
- VectorVest, Inc.
- Executive Premier Workshop
- One-Day Options Course
- OptionsPro
- Retirement Income Workshop
- Sure-Fire Trading Systems (VectorVest, Inc.)
- Trading as a Business Workshop
- VectorVest 7 EOD
- VectorVest 7 RealTime/IntraDay
- VectorVest AutoTester
- VectorVest Educational Services
- VectorVest OnLine
- VectorVest Options Analyzer
- VectorVest ProGraphics v6.0
- VectorVest ProTrader 7
- VectorVest RealTime Derby Tool
- VectorVest Simulator
- VectorVest Variator
- VectorVest Watchdog
