HOT TOPICS LIST
- MACD
- Fibonacci
- RSI
- Gann
- ADXR
- Stochastics
- Volume
- Triangles
- Futures
- Cycles
- Volatility
- ZIGZAG
- MESA
- Retracement
- Aroon
INDICATORS LIST
LIST OF TOPICS
PRINT THIS ARTICLE
by David Penn
In spite of recent weakness, a month-long indicator divergence still points toward a higher dollar.
Position: N/A
David Penn
Technical Writer for Technical Analysis of STOCKS & COMMODITIES magazine, Working-Money.com, and Traders.com Advantage.
PRINT THIS ARTICLE
REVERSAL
The Late Great Dollar Divergence
10/24/03 11:00:49 AMby David Penn
In spite of recent weakness, a month-long indicator divergence still points toward a higher dollar.
Position: N/A
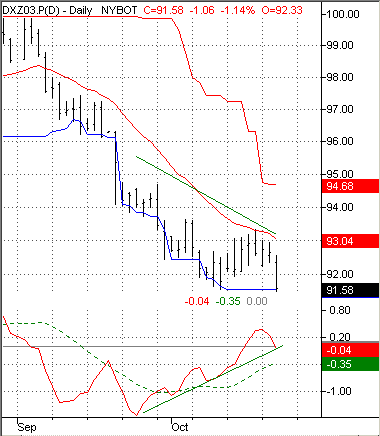
| Where does the case for a rebound in the U.S. dollar stand late in October? A growing positive divergence between price action in the December greenback, and the behavior of the 3/10 oscillator shown in the figure below, continues to point toward a higher dollar. The divergence begins late in September and only continues to grow and become more divergent as the dollar futures continued to decline. This positive divergence, so far, has been responsible for the dollar's rally in the middle of October, a rally that brought the December greenback up from the 91.50 area to as high as 93.33. |
| This rally failed, however, when it ran into resistance at the 20-day exponential moving average. As the rally topped out, prices retreated fairly swiftly, falling below the previous 20-day low at 91.55 on an intraday basis. |

|
| The positive divergence between price action and the indicator suggests a bottoming process in the greenback may be underway. |
| Graphic provided by: TradeStation. |
| |
| This development provides an opportunity for a reversal set-up I have mentioned often (most recently in "Intraday Tops and Bottoms in the USD/JPY," Traders.com Advantage, 10/21/03). This set-up has been referred to variously as "Turtle Soup Plus One" (Larry Connors in his book, Street Smarts) and the "2B test" (Victor Sperandeo in his book, Trader Vic -- Methods of a Wall Street Master). Here, a 20-day low was made on October 10th and then, after a rally, a lower 20-day low was made on an intraday basis on October 22nd. The reversal set-up ("Turtle Soup Plus One" or "2B test") then calls for a long entry if the bar immediately following the lower low bar trades as high as the low of the previous 20-day low. In this case, if the bar on October 23rd trades as high as 91.55, then a buy signal would take place. A protective stop would be appropriate -- per both Connors and Sperandeo -- just below the lower low at 91.43. |
| Such a trade would feature an initial risk in the neighborhood of 15 points. Should the bottom occur here, then the upside initially could be well above the 2 to 1 or 2.5 to 1 usually recommended as an appropriate risk/reward ratio. Given an entry near 91.57 and an intra-trough high of 93.33, an application of Weinstein's swing rule would call for an upside of as much as 95.23 in an initial move. |
Technical Writer for Technical Analysis of STOCKS & COMMODITIES magazine, Working-Money.com, and Traders.com Advantage.
| Title: | Technical Writer |
| Company: | Technical Analysis, Inc. |
| Address: | 4757 California Avenue SW |
| Seattle, WA 98116 | |
| Phone # for sales: | 206 938 0570 |
| Fax: | 206 938 1307 |
| Website: | www.Traders.com |
| E-mail address: | DPenn@traders.com |
Traders' Resource Links | |
| Charting the Stock Market: The Wyckoff Method -- Books | |
| Working-Money.com -- Online Trading Services | |
| Traders.com Advantage -- Online Trading Services | |
| Technical Analysis of Stocks & Commodities -- Publications and Newsletters | |
| Working Money, at Working-Money.com -- Publications and Newsletters | |
| Traders.com Advantage -- Publications and Newsletters | |
| Professional Traders Starter Kit -- Software | |
Click here for more information about our publications!
Comments
Date: 10/29/03Rank: 3Comment:

Request Information From Our Sponsors
- StockCharts.com, Inc.
- Candle Patterns
- Candlestick Charting Explained
- Intermarket Technical Analysis
- John Murphy on Chart Analysis
- John Murphy's Chart Pattern Recognition
- John Murphy's Market Message
- MurphyExplainsMarketAnalysis-Intermarket Analysis
- MurphyExplainsMarketAnalysis-Visual Analysis
- StockCharts.com
- Technical Analysis of the Financial Markets
- The Visual Investor
- VectorVest, Inc.
- Executive Premier Workshop
- One-Day Options Course
- OptionsPro
- Retirement Income Workshop
- Sure-Fire Trading Systems (VectorVest, Inc.)
- Trading as a Business Workshop
- VectorVest 7 EOD
- VectorVest 7 RealTime/IntraDay
- VectorVest AutoTester
- VectorVest Educational Services
- VectorVest OnLine
- VectorVest Options Analyzer
- VectorVest ProGraphics v6.0
- VectorVest ProTrader 7
- VectorVest RealTime Derby Tool
- VectorVest Simulator
- VectorVest Variator
- VectorVest Watchdog
