HOT TOPICS LIST
- MACD
- Fibonacci
- RSI
- Gann
- ADXR
- Stochastics
- Volume
- Triangles
- Futures
- Cycles
- Volatility
- ZIGZAG
- MESA
- Retracement
- Aroon
INDICATORS LIST
LIST OF TOPICS
PRINT THIS ARTICLE
by Koos van der Merwe
Has Avigen peaked? The stock gained after an advisory committee of the U.S. National Institute of Health stated it would recommend the initiation of human clinical trials for Avigen's AV201, a gene therapy for advanced Parkinson's disease.
Position: Accumulate
Koos van der Merwe
Has been a technical analyst since 1969, and has worked as a futures and options trader with First Financial Futures in Johannesburg, South Africa.
PRINT THIS ARTICLE
CUP WITH HANDLE
Avigen - A Biotechnology Stock Worth Watching
10/23/03 08:46:28 AMby Koos van der Merwe
Has Avigen peaked? The stock gained after an advisory committee of the U.S. National Institute of Health stated it would recommend the initiation of human clinical trials for Avigen's AV201, a gene therapy for advanced Parkinson's disease.
Position: Accumulate
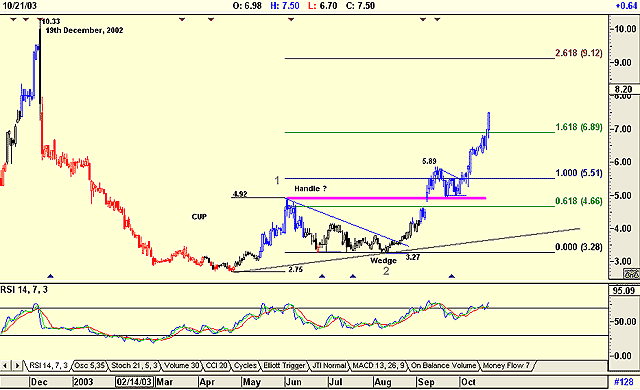
| Like all Biotech companies, this company has had its drama, falling on December 19th from $10.33 to $2.70 by April 23, 2003. Since then it has started moving up strongly, probably buoyed by the announcement that Bayer Biological Products Division (BP) of Bayer Health Care has loaned the company $2.5 million to continue with the development program of Coagulin-B(R), a gene therapy treatment for hemophilia B. |
| Now, Avigen has announced that it has a possible product for advanced Parkinson's disease. It is unusual for a biotech company to have two products in clinical trials at the same time, possibly the reason for the sudden increase in the stock's value. However, what do the charts tell us? Notice the large cup and handle pattern on the chart below. The handle moved into a wedge formation suggesting a target of $5.45. (4.92 - 2.75 = 2.17 + 3.27 = 5.44). The price actually reached $5.89 before consolidating. |

|
| Figure 1: Daily chart of Avigen. |
| Graphic provided by: AdvancedGET. |
| |
| If this falling wedge can be considered part of the handle formation, then it broke upwards on a gap at $4.92 and now has a new target of $7.09, calculated as follows: $4.92 - $2.75 (depth of the cup) = $2.17 which added to $4.92 = $7.09. The current price for the share is $7.50, a great deal higher than the targeted price. This leads me to look for another strategy to determine a possible price target. I will now apply wave theory, and I have made the assumption that the low of $2.17 is the end of a "C" wave. A weekly chart (not shown) suggests this is a reasonable assumption. This then means the rise to $4.92 is a wave 1 with the falling wedge to $3.27, wave 2. Projecting a Fibonacci target of the length of wave 1 from the low of wave 2 gives me the target levels shown on the chart. |
| With the break above 1.618 the possibility exists that the price could rise to the 2.618 level of $9.12. However, with an RSI that is oversold and suggesting a divergent sell signal, there may be consolidation once again at present levels as the results of the clinical trials become known. This is definitely a company with potential and is worth watching. |
Has been a technical analyst since 1969, and has worked as a futures and options trader with First Financial Futures in Johannesburg, South Africa.
| Address: | 3256 West 24th Ave |
| Vancouver, BC | |
| Phone # for sales: | 6042634214 |
| E-mail address: | petroosp@gmail.com |
Click here for more information about our publications!
Comments
Date: 10/25/03Rank: 5Comment:
Date: 10/30/03Rank: 5Comment:

Request Information From Our Sponsors
- StockCharts.com, Inc.
- Candle Patterns
- Candlestick Charting Explained
- Intermarket Technical Analysis
- John Murphy on Chart Analysis
- John Murphy's Chart Pattern Recognition
- John Murphy's Market Message
- MurphyExplainsMarketAnalysis-Intermarket Analysis
- MurphyExplainsMarketAnalysis-Visual Analysis
- StockCharts.com
- Technical Analysis of the Financial Markets
- The Visual Investor
- VectorVest, Inc.
- Executive Premier Workshop
- One-Day Options Course
- OptionsPro
- Retirement Income Workshop
- Sure-Fire Trading Systems (VectorVest, Inc.)
- Trading as a Business Workshop
- VectorVest 7 EOD
- VectorVest 7 RealTime/IntraDay
- VectorVest AutoTester
- VectorVest Educational Services
- VectorVest OnLine
- VectorVest Options Analyzer
- VectorVest ProGraphics v6.0
- VectorVest ProTrader 7
- VectorVest RealTime Derby Tool
- VectorVest Simulator
- VectorVest Variator
- VectorVest Watchdog
