HOT TOPICS LIST
- MACD
- Fibonacci
- RSI
- Gann
- ADXR
- Stochastics
- Volume
- Triangles
- Futures
- Cycles
- Volatility
- ZIGZAG
- MESA
- Retracement
- Aroon
INDICATORS LIST
LIST OF TOPICS
PRINT THIS ARTICLE
by David Penn
A popular reversal set-up shows itself--twice!--within six days, once from the bottom then again from the top.
Position: N/A
David Penn
Technical Writer for Technical Analysis of STOCKS & COMMODITIES magazine, Working-Money.com, and Traders.com Advantage.
PRINT THIS ARTICLE
REVERSAL
Intraday Tops And Bottoms In The USD/JPY
10/21/03 10:54:53 AMby David Penn
A popular reversal set-up shows itself--twice!--within six days, once from the bottom then again from the top.
Position: N/A
| In the world of technical analysis, there are systems, methods and set-ups -- each with its own advantages and disadvantages to offer traders. For those who find trading systems too impersonal and restrictive, and trading methods too vulnerable to the subjectivity of their creator(s), trading set-ups have a certain appeal. In general, trading set-ups are straightforward and easy to understand, often short-term or "swing" in application, and perhaps the easiest to modify to suit an individual traders' style and personality. Some are critical, however, of the fact that trading set-ups often require either a great deal of patience in order to wait for and then pounce on an opportunity, or the ability to scan a great many markets at once for the instant in which a trading set-up appears. Unlike trading systems or methods, trading set-ups can often be the hardest to quantify in code -- thus making set-ups harder to perform automatically. |
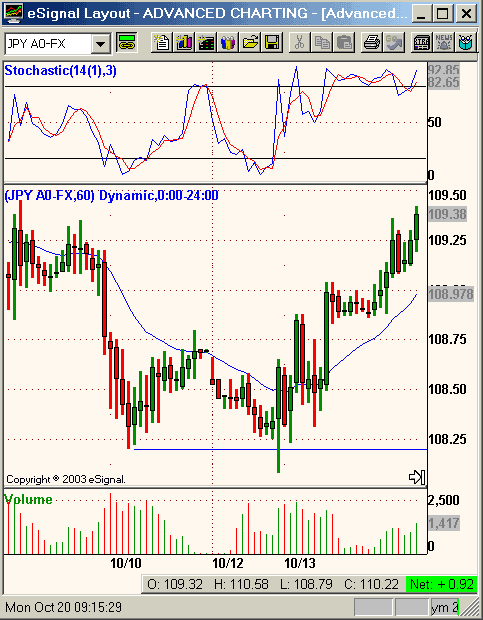
| So it was quite the pleasure to find, in an intraday chart of the USD/JPY, two examples of one of the more popular and effective, reversal-oriented trading set-ups. That these two instances were also opposites -- one set-up successfully marked a bottom while the other set-up successfully marked a top -- was a nice bonus. The set-up I am referring to has been referred to as the "2B test of top" by Victor Sperandeo in his book, Trader Vic -- Methods of a Wall Street Master, and as "Turtle Soup/Turtle Soup Plus One" by Lawrence A. Connors in his book, Street Smarts, co-authored with Linda Bradford Raschke. While Sperandeo and Connors talk about this set-up in different terms, the fact of the matter is that the factors both use in determining when the set-up is present are remarkably similar. This set-up is, as I suggested at the outset, quite straightforward. Look at the chart of USD/JPY. Note how the market makes a 20-bar low early on October 10th at 108.20. The market then rallies for a period of time, briefly rising about the 20-bar moving average, then falls back toward the old 20-bar low on October 12th. Here, the market makes a lower low (vis-a-vis the last 20-bar low) at 108.08. |

|
| Figure 1: A 2B test of bottom/"Turtle Soup Plus One" set-up in this hourly chart of USD/JPY helps anticipate a breakout from a double bottom. |
| Graphic provided by: eSignal. |
| |
| Both the 2B test and the "Turtle Soup Plus One" set-ups suggest watching the bar immediately after the lower 20-bar low. If prices -- as represented by this bar -- trade above the low point of the higher of the 20-bar low, then the set-up calls for a long entry a few ticks above the previous low. In the case of USD/JPY, this would mean a long entry at approximately 108.22. Here, USD/JPY's follow-up bar opened at 108.57, which would have been the long entry point for this trade per the 2B and Turtle Soup Plus One set-ups. A stop-loss would be set just below the lower of the two 20-bar lows -- in this case, at 108.06. The first few hours of this trade are negative, as USD/JPY retreats as low as 108.31. However USD/JPY began moving up strongly and, by the eighth hour of the trade was at 108.99 -- a 42 point gain. As the chart shows, USD/JPY continued to move up after that wide range bar, eventually reaching as high as 110.25 before falling back below its 20-bar exponential moving average at 109.44. |
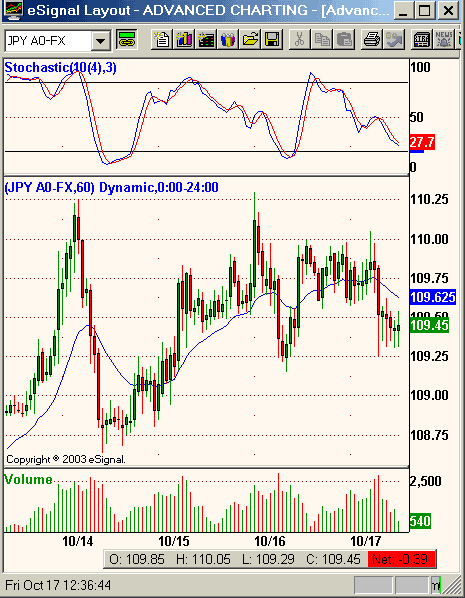
 Figure 2: A 2B test of top/"Turtle Soup Plus One" set-up in this hourly chart of USD/JPY. Interestingly, the peak from the advance that flowed from the successful test of bottom mentioned previously is part of a subsequent successful test of top. USD/JPY notched a 20-bar high at 110.25 on October 14th, then retreated swiftly and sharply, falling beneath its 20 bar moving average to just south of 108.75. USD/JPY rallied from these lows to set a higher 20 bar high (higher vis a vis the previous 20 bar high at 110.25). With the higher high at 110.30, a possible 2B "Turtle Soup Plus One" set-up was at hand. The strategy for this set-up plays out as follows: Sell the next bar (the bar following the higher 20 bar high) if it trades below 110.23. In this instance, the next bar opens significantly lower (in itself a bearish sign) at 110.08. This would be the short entry level per both the 2B and "Turtle Soup Plus One" set-ups. A stop-buy a few ticks above 110.30 would make for the protective stop. With 22-odd points of risk, a 2-1/3-1 risk/reward would posit a price goal of 44 to 66 points to the downside. By the end of the trade's sixth hour, the USD/JPY closed at 109.36. |
Technical Writer for Technical Analysis of STOCKS & COMMODITIES magazine, Working-Money.com, and Traders.com Advantage.
| Title: | Technical Writer |
| Company: | Technical Analysis, Inc. |
| Address: | 4757 California Avenue SW |
| Seattle, WA 98116 | |
| Phone # for sales: | 206 938 0570 |
| Fax: | 206 938 1307 |
| Website: | www.Traders.com |
| E-mail address: | DPenn@traders.com |
Traders' Resource Links | |
| Charting the Stock Market: The Wyckoff Method -- Books | |
| Working-Money.com -- Online Trading Services | |
| Traders.com Advantage -- Online Trading Services | |
| Technical Analysis of Stocks & Commodities -- Publications and Newsletters | |
| Working Money, at Working-Money.com -- Publications and Newsletters | |
| Traders.com Advantage -- Publications and Newsletters | |
| Professional Traders Starter Kit -- Software | |
Click here for more information about our publications!
PRINT THIS ARTICLE

Request Information From Our Sponsors
- StockCharts.com, Inc.
- Candle Patterns
- Candlestick Charting Explained
- Intermarket Technical Analysis
- John Murphy on Chart Analysis
- John Murphy's Chart Pattern Recognition
- John Murphy's Market Message
- MurphyExplainsMarketAnalysis-Intermarket Analysis
- MurphyExplainsMarketAnalysis-Visual Analysis
- StockCharts.com
- Technical Analysis of the Financial Markets
- The Visual Investor
- VectorVest, Inc.
- Executive Premier Workshop
- One-Day Options Course
- OptionsPro
- Retirement Income Workshop
- Sure-Fire Trading Systems (VectorVest, Inc.)
- Trading as a Business Workshop
- VectorVest 7 EOD
- VectorVest 7 RealTime/IntraDay
- VectorVest AutoTester
- VectorVest Educational Services
- VectorVest OnLine
- VectorVest Options Analyzer
- VectorVest ProGraphics v6.0
- VectorVest ProTrader 7
- VectorVest RealTime Derby Tool
- VectorVest Simulator
- VectorVest Variator
- VectorVest Watchdog
