HOT TOPICS LIST
- MACD
- Fibonacci
- RSI
- Gann
- ADXR
- Stochastics
- Volume
- Triangles
- Futures
- Cycles
- Volatility
- ZIGZAG
- MESA
- Retracement
- Aroon
INDICATORS LIST
LIST OF TOPICS
PRINT THIS ARTICLE
by Gary Grosschadl
General Motors, Corporation (GM) was riding high until recently. Now its forward momentum could be stalled.
Position: Sell
Gary Grosschadl
Independent Canadian equities trader and technical analyst based in Peterborough
Ontario, Canada.
PRINT THIS ARTICLE
CHART ANALYSIS
General Motors Gearing Down
10/17/03 12:41:31 PMby Gary Grosschadl
General Motors, Corporation (GM) was riding high until recently. Now its forward momentum could be stalled.
Position: Sell
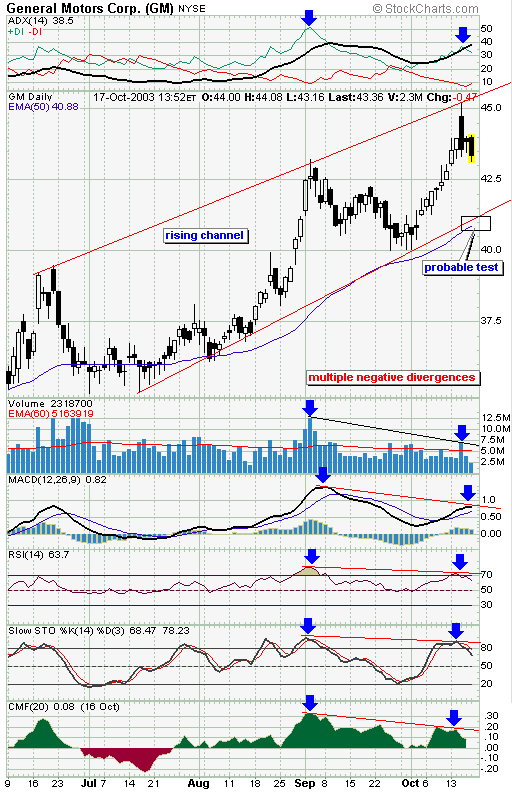
| Like the markets, the GM chart was surging higher until a raft of negative divergences hinted at some profit taking. Now it looks like a sell on recent news. General Motors posted a third quarter profit of $425-million, reversing last year's loss. |
| Perhaps chart watchers were seeing what I saw on the chart below -- too many negative divergences to sustain the new highs. Of particular note are the volume and Chaiken money flow indicator. When these show less conviction from buyers, a downturn should be expected. |

|
| GM's daily chart implies a test of the lower channel. |
| Graphic provided by: Stockcharts.com. |
| |
| How far this retracement goes is up for speculation. The chart shows a rising channel with the lower trendline near the 50-day EMA. This could well be an important test coming up. No doubt the main indices have been suddenly under downward pressure in the last few trading sessions, and this will likely have some effect. Longer-term traders may decide to wait for the outcome of this retracement test while shorter-term traders might consider taking earlier protective measures to lock in recent gains. A successful bounce off the lower channel implies the rising trend is still in effect, however failure there has obvious downside implications. |
Independent Canadian equities trader and technical analyst based in Peterborough
Ontario, Canada.
| Website: | www.whatsonsale.ca/financial.html |
| E-mail address: | gwg7@sympatico.ca |
Click here for more information about our publications!
Comments
Date: 10/20/03Rank: 5Comment: Very good article, I find all your articles very imformative. I am new to technical analysts and would like some pointers from experience. Could you tell me were the best place is to begin? To many different indicators and averages to use, how do you know which ones work best? Thanks for your opinion and help. Earl

Request Information From Our Sponsors
- StockCharts.com, Inc.
- Candle Patterns
- Candlestick Charting Explained
- Intermarket Technical Analysis
- John Murphy on Chart Analysis
- John Murphy's Chart Pattern Recognition
- John Murphy's Market Message
- MurphyExplainsMarketAnalysis-Intermarket Analysis
- MurphyExplainsMarketAnalysis-Visual Analysis
- StockCharts.com
- Technical Analysis of the Financial Markets
- The Visual Investor
- VectorVest, Inc.
- Executive Premier Workshop
- One-Day Options Course
- OptionsPro
- Retirement Income Workshop
- Sure-Fire Trading Systems (VectorVest, Inc.)
- Trading as a Business Workshop
- VectorVest 7 EOD
- VectorVest 7 RealTime/IntraDay
- VectorVest AutoTester
- VectorVest Educational Services
- VectorVest OnLine
- VectorVest Options Analyzer
- VectorVest ProGraphics v6.0
- VectorVest ProTrader 7
- VectorVest RealTime Derby Tool
- VectorVest Simulator
- VectorVest Variator
- VectorVest Watchdog
