HOT TOPICS LIST
- MACD
- Fibonacci
- RSI
- Gann
- ADXR
- Stochastics
- Volume
- Triangles
- Futures
- Cycles
- Volatility
- ZIGZAG
- MESA
- Retracement
- Aroon
INDICATORS LIST
LIST OF TOPICS
PRINT THIS ARTICLE
by Kevin Hopson
Devon Energy looks to be completing the right side of a head and shoulders pattern, which could indicate a recent top in the stock price.
Position: Hold
Kevin Hopson
Kevin has been a technical analyst for roughly 10 years now. Previously, Kevin owned his own business and acted as a registered investment advisor, specializing in energy. He was also a freelance oil analyst for Orient Trading Co., a commodity futures trading firm in Japan. Kevin is currently a freelance writer.
PRINT THIS ARTICLE
HEAD & SHOULDERS
Potential Head And Shoulders Top For Devon Energy?
10/20/03 09:19:34 AMby Kevin Hopson
Devon Energy looks to be completing the right side of a head and shoulders pattern, which could indicate a recent top in the stock price.
Position: Hold
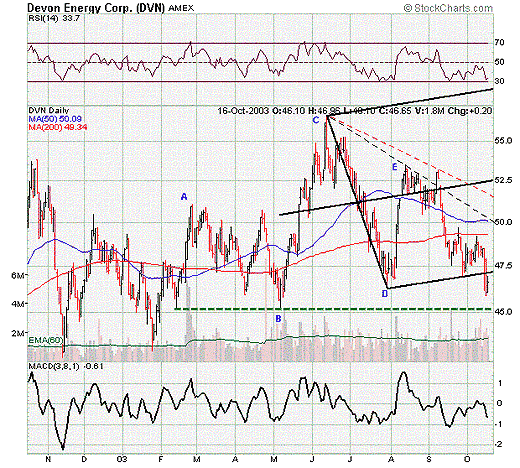
| Devon Energy (DVN) looks to be completing the right side of a head and shoulders pattern, which is often a topping/reversal pattern for prices. Just to clarify, the left shoulder is defined by the A (peak) and B (bottom) pivot points, while the head is defined by the B-C-D pivot points. The developing right shoulder is defined by the D and E pivot points, with the completion of the pattern likely to occur along the neckline - or a potential triple bottom - around the $45.00 level. |
| The last time I touched on Devon, I said that a break of June's downtrend line (dotted black line) was needed for the technicals to turn bullish. Unfortunately, September's rally above this trendline was short-lived, as Devon's breakout failed miserably and prices proceeded to pull back. Because of this, a new downtrend line has developed, which is illustrated by the dotted red line. Another bearish sign was the stock's recent breach of support along the bottom parallel line of the black pitchfork. As a result, there is a good possibility that Devon will test a developing triple bottom down around the $45.00 level. |

|
| Graphic provided by: Stockcharts.com. |
| |
| If so, it is important that the stock hold support here. Otherwise, the neckline of the head and shoulders pattern would be breached, thus indicating the potential for further significant weakness in the stock price. However, there are a couple of positive signs. For one, head and shoulders patterns are not always reversal patterns. Though it is rare to see a head and shoulders pattern act as a continuation pattern, it is possible. |
| Also, Devon has a significant amount of open interest (stretching out to April '04) in the $45.00 put options. As a result, the stock should find significant support here, as sellers of these contracts will have an interest in keeping prices above the $45.00 level. Though the outlook for Devon is uncertain, I would remain cautious in the near-term and watch the $45.00 level very carefully. |
Kevin has been a technical analyst for roughly 10 years now. Previously, Kevin owned his own business and acted as a registered investment advisor, specializing in energy. He was also a freelance oil analyst for Orient Trading Co., a commodity futures trading firm in Japan. Kevin is currently a freelance writer.
| Glen Allen, VA | |
| E-mail address: | hopson_1@yahoo.com |
Click here for more information about our publications!
Comments
Date: 10/20/03Rank: 5Comment: Good article, how do you know what to look for when sifting through 1000 s of stocks? Also how do you know which indicators to use to find the most reliable direction of a stock? Thanks for your imput, Earl

Request Information From Our Sponsors
- StockCharts.com, Inc.
- Candle Patterns
- Candlestick Charting Explained
- Intermarket Technical Analysis
- John Murphy on Chart Analysis
- John Murphy's Chart Pattern Recognition
- John Murphy's Market Message
- MurphyExplainsMarketAnalysis-Intermarket Analysis
- MurphyExplainsMarketAnalysis-Visual Analysis
- StockCharts.com
- Technical Analysis of the Financial Markets
- The Visual Investor
- VectorVest, Inc.
- Executive Premier Workshop
- One-Day Options Course
- OptionsPro
- Retirement Income Workshop
- Sure-Fire Trading Systems (VectorVest, Inc.)
- Trading as a Business Workshop
- VectorVest 7 EOD
- VectorVest 7 RealTime/IntraDay
- VectorVest AutoTester
- VectorVest Educational Services
- VectorVest OnLine
- VectorVest Options Analyzer
- VectorVest ProGraphics v6.0
- VectorVest ProTrader 7
- VectorVest RealTime Derby Tool
- VectorVest Simulator
- VectorVest Variator
- VectorVest Watchdog
