HOT TOPICS LIST
- MACD
- Fibonacci
- RSI
- Gann
- ADXR
- Stochastics
- Volume
- Triangles
- Futures
- Cycles
- Volatility
- ZIGZAG
- MESA
- Retracement
- Aroon
INDICATORS LIST
LIST OF TOPICS
PRINT THIS ARTICLE
by Koos van der Merwe
Every technician and investor knows the story of AOL Time Warner, so there is no need to repeat it here, but what of the future? Is it worth taking the chance and buying at these levels, hoping that a long-term hold will recover losses or capture outstanding profits?
Position: Accumulate
Koos van der Merwe
Has been a technical analyst since 1969, and has worked as a futures and options trader with First Financial Futures in Johannesburg, South Africa.
PRINT THIS ARTICLE
ELLIOTT WAVE
AOL Time Warner
10/17/03 12:12:35 PMby Koos van der Merwe
Every technician and investor knows the story of AOL Time Warner, so there is no need to repeat it here, but what of the future? Is it worth taking the chance and buying at these levels, hoping that a long-term hold will recover losses or capture outstanding profits?
Position: Accumulate
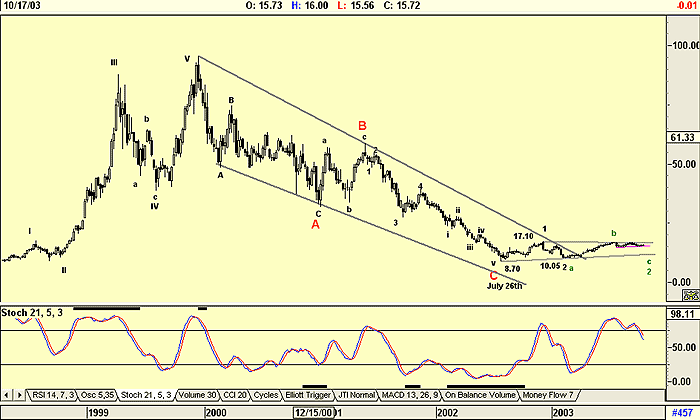
| Figure 1 shows a weekly chart with an Elliott Wave count that follows my first law of Wave theory, namely, the count calling an end to the bear trend for the share at 'C' "looks" right. However, from there on, it "looks" wrong. Wave 1 up and wave 2 correction down of a rising trend look correct, but wave 3 so far looks like a failure, if it is wave 3. This is my preferred count. My alternate count follows the falling stochastic oscillator, which is suggesting that it is an extended wave 2 falling in an a, b, c correction (green). Both scenarios appear to be likely with the alternate count on the weekly chart being the primary count. This could mean there is still more downside to the share price. |

|
| Figure 1: AOL Time Warner's weekly chart with my Elliott Wave count. |
| Graphic provided by: AdvancedGET. |
| |
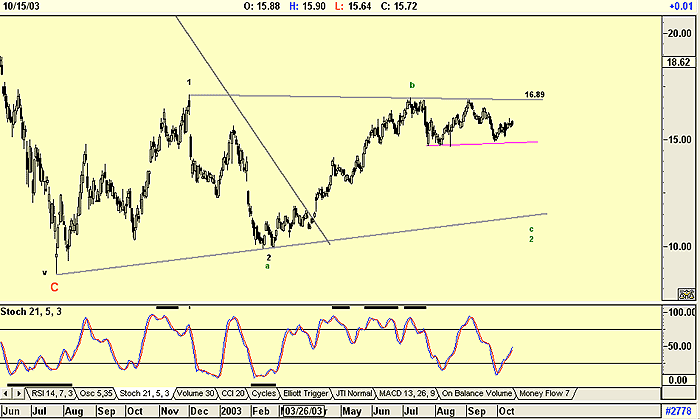
On the daily chart however, there is a slightly different picture. I have included my weekly count on the chart and you can see my count in a rising market more clearly. However my preferred count now seems the more likely, with the present sideways trend forming a flag that could break upwards should the price test and break above the 16.89 level. However, this resistance is extremely strong as it is a triple top formation. Also note the daily stochastic oscillator is bullish.  Figure 2: Daily chart of AOL-Time Warner. So we have two pictures. The weekly chart is bearish and the daily chart could be bullish, but not yet. I will watch the daily chart for a breakout above 16.89, and if this is confirmed by the weekly chart, then I would be a buyer, and for the long-term. I would know the trend is a weekly wave 3 up with a possible minimum target of 23.64. |
| This target is derived from the following: Wave 1 = 8.40 (17.10 - 8.70). 8.40 x 1.618 = 13.59 + wave 2 bottom at 10.05 = $23.64. Of course, this figure need not necessarily be the top of wave 3, but it is a guide. |
Has been a technical analyst since 1969, and has worked as a futures and options trader with First Financial Futures in Johannesburg, South Africa.
| Address: | 3256 West 24th Ave |
| Vancouver, BC | |
| Phone # for sales: | 6042634214 |
| E-mail address: | petroosp@gmail.com |
Click here for more information about our publications!
Comments
Date: 10/18/03Rank: 5Comment: I find your articles posted on this web site to be very informative and helpful. I am relatively new to technical analysts and find it to be confusing at times. Where would you suggest I might start?
Thanks, Earl

Request Information From Our Sponsors
- StockCharts.com, Inc.
- Candle Patterns
- Candlestick Charting Explained
- Intermarket Technical Analysis
- John Murphy on Chart Analysis
- John Murphy's Chart Pattern Recognition
- John Murphy's Market Message
- MurphyExplainsMarketAnalysis-Intermarket Analysis
- MurphyExplainsMarketAnalysis-Visual Analysis
- StockCharts.com
- Technical Analysis of the Financial Markets
- The Visual Investor
- VectorVest, Inc.
- Executive Premier Workshop
- One-Day Options Course
- OptionsPro
- Retirement Income Workshop
- Sure-Fire Trading Systems (VectorVest, Inc.)
- Trading as a Business Workshop
- VectorVest 7 EOD
- VectorVest 7 RealTime/IntraDay
- VectorVest AutoTester
- VectorVest Educational Services
- VectorVest OnLine
- VectorVest Options Analyzer
- VectorVest ProGraphics v6.0
- VectorVest ProTrader 7
- VectorVest RealTime Derby Tool
- VectorVest Simulator
- VectorVest Variator
- VectorVest Watchdog
