HOT TOPICS LIST
- MACD
- Fibonacci
- RSI
- Gann
- ADXR
- Stochastics
- Volume
- Triangles
- Futures
- Cycles
- Volatility
- ZIGZAG
- MESA
- Retracement
- Aroon
INDICATORS LIST
LIST OF TOPICS
PRINT THIS ARTICLE
by David Penn
After bouncing from the lows in July 2002 and March 2003, will the third time be a charm for telecom?
Position: N/A
David Penn
Technical Writer for Technical Analysis of STOCKS & COMMODITIES magazine, Working-Money.com, and Traders.com Advantage.
PRINT THIS ARTICLE
ELLIOTT WAVE
Telecom's Triple Drop
10/16/03 11:32:40 AMby David Penn
After bouncing from the lows in July 2002 and March 2003, will the third time be a charm for telecom?
Position: N/A
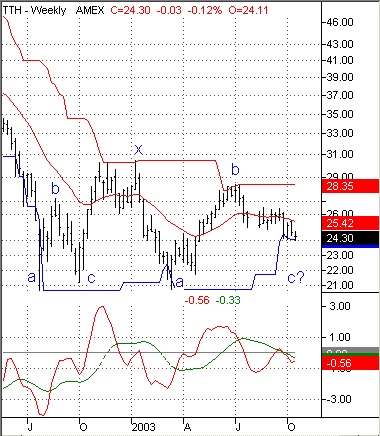
| Is the bull market rally off the March 2003 lows over? It depends on which sector you ask. There are quite a few sectors -- semiconductors, retail, Internets, regional banks -- that would all answer with a resounding "No!" But if you asked telecom, a sector that appears to have peaked in late June of this year, you'd be more likely answered with a "Well, kinda. . ." A long-term chart of the telecom HOLDRs (TTH) makes the case for "Well, kinda. . ." all the more clear. |
| The telecom HOLDRs have been in a bear market almost since inception. From a February 2000 high of about 88 to present, this exchange-traded fund has lost more than 70% of its value. In fact, the consolidation between 30 and 21 that began in the summer of 2002 was the first respite TTH has had from almost perpetual selling. |

|
| Figure 1: The consolidation in the telecom HOLDRs appears to have taken the form of an Elliott Wave double zigzag. |
| Graphic provided by: TradeStation. |
| |
| Unfortunately for telecom bulls, it seems that this selling may not be immediately over. If the double zigzag formation presented in Figure 1 is accurate, then TTH is likely to fall further -- at least to a test of the May 2003 lows just south of 221. What is worse is that the final "c" wave of this double zigzag could certainly take TTH even lower than 21. There is no guarantee that the spring 2003 lows will hold. Writing about double zigzags in Elliott Wave Principle, authors Frost and Prechter note that: "In all of these cases the market is hesitating and acts as if one three weren't enough, as if more time were needed to straighten out whatever 'reasons' the market had for pausing in the first place. Sometimes stock prices seem to be waiting for economic fundamentals to begin to catch up with the market's expectations." |
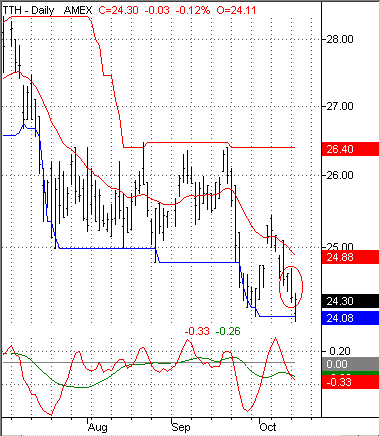
| While we cannot know just why the market for telecom stocks is "hesitating," we can made a fairly educated guess that whatever is causing the hesitation, the likely outcome of this deliberation in the market is a verdict to continue moving down. Given that TTH, on the daily charts, is currently falling out of a two-month consolidation that began back in early July, and that a swing trading short signal (based on Dave Landry's 2/20 EMA Breakout System published in TASC in December 1996), the case for telecom bearishness is underscored. |
 Figure 2: After a two-month consolidation, TTH breaks out on the downside. The circled area represents a short signal based on Dave Landry's 2/20 EMA Breakout System (TASC 12/96). |
Technical Writer for Technical Analysis of STOCKS & COMMODITIES magazine, Working-Money.com, and Traders.com Advantage.
| Title: | Technical Writer |
| Company: | Technical Analysis, Inc. |
| Address: | 4757 California Avenue SW |
| Seattle, WA 98116 | |
| Phone # for sales: | 206 938 0570 |
| Fax: | 206 938 1307 |
| Website: | www.Traders.com |
| E-mail address: | DPenn@traders.com |
Traders' Resource Links | |
| Charting the Stock Market: The Wyckoff Method -- Books | |
| Working-Money.com -- Online Trading Services | |
| Traders.com Advantage -- Online Trading Services | |
| Technical Analysis of Stocks & Commodities -- Publications and Newsletters | |
| Working Money, at Working-Money.com -- Publications and Newsletters | |
| Traders.com Advantage -- Publications and Newsletters | |
| Professional Traders Starter Kit -- Software | |
Click here for more information about our publications!
Comments
Date: 10/18/03Rank: 5Comment: I am learning alot about technical analysts and find your articles posted on this web site helpful.But there are so many indicators and types of analysts out there and it becomes confusing. What would your suggestion be to someone new to this subject, to help them learn?

Request Information From Our Sponsors
- VectorVest, Inc.
- Executive Premier Workshop
- One-Day Options Course
- OptionsPro
- Retirement Income Workshop
- Sure-Fire Trading Systems (VectorVest, Inc.)
- Trading as a Business Workshop
- VectorVest 7 EOD
- VectorVest 7 RealTime/IntraDay
- VectorVest AutoTester
- VectorVest Educational Services
- VectorVest OnLine
- VectorVest Options Analyzer
- VectorVest ProGraphics v6.0
- VectorVest ProTrader 7
- VectorVest RealTime Derby Tool
- VectorVest Simulator
- VectorVest Variator
- VectorVest Watchdog
- StockCharts.com, Inc.
- Candle Patterns
- Candlestick Charting Explained
- Intermarket Technical Analysis
- John Murphy on Chart Analysis
- John Murphy's Chart Pattern Recognition
- John Murphy's Market Message
- MurphyExplainsMarketAnalysis-Intermarket Analysis
- MurphyExplainsMarketAnalysis-Visual Analysis
- StockCharts.com
- Technical Analysis of the Financial Markets
- The Visual Investor
