HOT TOPICS LIST
- MACD
- Fibonacci
- RSI
- Gann
- ADXR
- Stochastics
- Volume
- Triangles
- Futures
- Cycles
- Volatility
- ZIGZAG
- MESA
- Retracement
- Aroon
INDICATORS LIST
LIST OF TOPICS
PRINT THIS ARTICLE
by David Penn
After a two-year bull market and a one year correction, cocoa is poised to move higher.
Position: N/A
David Penn
Technical Writer for Technical Analysis of STOCKS & COMMODITIES magazine, Working-Money.com, and Traders.com Advantage.
PRINT THIS ARTICLE
REVERSAL
December Cocoa's Comeback
10/14/03 01:15:49 PMby David Penn
After a two-year bull market and a one year correction, cocoa is poised to move higher.
Position: N/A
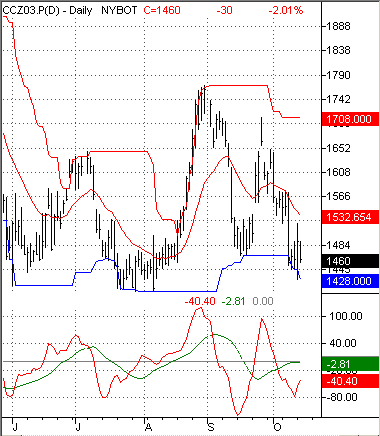
| When I last wrote about cocoa futures ("Cocoa's Double Bottom," Traders.com Advantage, August 22, 2003), I was anticipating higher prices. Both a double bottom formation and a bullish positive divergence between price and the 3/10 oscillator suggested that a bottom of some significance had formed in cocoa, and that the path of least resistance, for the time being, was upward. At the time, cocoa (basis December) was trading between 1600 and 1625, and was testing the highs of the previous month. |
| The double bottom pointed to back in late August did not fully materialize. While prices did continue to advance throughout August, the end of the month saw cocoa prices peak near 1770 and begin to soften, falling back to near 1470 by mid-September. |

|
| Figure 1: This sideways movement may mask a bottoming process in December cocoa. |
| Graphic provided by: TradeStation. |
| |
| Cocoa made a brief rally from the September lows. But prices for December cocoa retreated swiftly back to the 1460 area by mid-October. Importantly cocoa prices took out the September low, but did not fall beneath the late July/early August lows. Additionally, consider the positive divergence between the September and October lows in the 3/10 oscillator and the like lows in price action. The fact that the indicator has registered higher lows in September and October while the market itself has registered lower lows is a bullish indication that cocoa prices are likely to move higher in the near-term. |
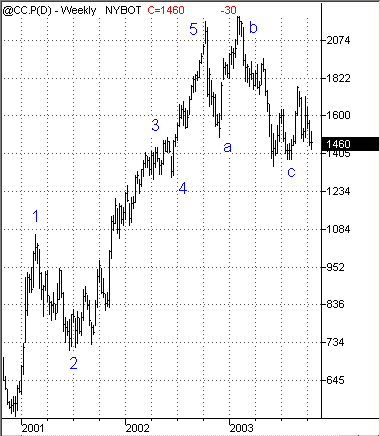
 Figure 2: This Elliott Wave count suggests that if the current lows hold, cocoa could begin a new bull market going forward. I cannot resist providing an Elliott Wave count that has contextualized my thinking of cocoa. Based on the above count, we could have projected a wave 5 top at 1978. This projection is based on Robert Fischer's methods, published in his book, Fibonacci Applications and Strategies for Traders, and uses the amplitudes of wave one and wave three and the Fibonacci numbers 1.618 and 0.618 to project the extent of the fifth and final wave. |
| What is key to this count is that cocoa find support at or above current levels. This count could still be valid if cocoa retreats to the level of the wave four lows (approximately 1300). However, recent price action in cocoa suggests that it is possible that cocoa has bottomed within the wave four (i.e., between 1490 and 1300), as opposed to at the lowest point of wave four -- which is typically viewed as the maximum correction depth of an A-B-C correction following a five-wave bull market advance. |
Technical Writer for Technical Analysis of STOCKS & COMMODITIES magazine, Working-Money.com, and Traders.com Advantage.
| Title: | Technical Writer |
| Company: | Technical Analysis, Inc. |
| Address: | 4757 California Avenue SW |
| Seattle, WA 98116 | |
| Phone # for sales: | 206 938 0570 |
| Fax: | 206 938 1307 |
| Website: | www.Traders.com |
| E-mail address: | DPenn@traders.com |
Traders' Resource Links | |
| Charting the Stock Market: The Wyckoff Method -- Books | |
| Working-Money.com -- Online Trading Services | |
| Traders.com Advantage -- Online Trading Services | |
| Technical Analysis of Stocks & Commodities -- Publications and Newsletters | |
| Working Money, at Working-Money.com -- Publications and Newsletters | |
| Traders.com Advantage -- Publications and Newsletters | |
| Professional Traders Starter Kit -- Software | |
Click here for more information about our publications!
PRINT THIS ARTICLE

Request Information From Our Sponsors
- StockCharts.com, Inc.
- Candle Patterns
- Candlestick Charting Explained
- Intermarket Technical Analysis
- John Murphy on Chart Analysis
- John Murphy's Chart Pattern Recognition
- John Murphy's Market Message
- MurphyExplainsMarketAnalysis-Intermarket Analysis
- MurphyExplainsMarketAnalysis-Visual Analysis
- StockCharts.com
- Technical Analysis of the Financial Markets
- The Visual Investor
- VectorVest, Inc.
- Executive Premier Workshop
- One-Day Options Course
- OptionsPro
- Retirement Income Workshop
- Sure-Fire Trading Systems (VectorVest, Inc.)
- Trading as a Business Workshop
- VectorVest 7 EOD
- VectorVest 7 RealTime/IntraDay
- VectorVest AutoTester
- VectorVest Educational Services
- VectorVest OnLine
- VectorVest Options Analyzer
- VectorVest ProGraphics v6.0
- VectorVest ProTrader 7
- VectorVest RealTime Derby Tool
- VectorVest Simulator
- VectorVest Variator
- VectorVest Watchdog
