

HOT TOPICS LIST
- MACD
- Fibonacci
- RSI
- Gann
- ADXR
- Stochastics
- Volume
- Triangles
- Futures
- Cycles
- Volatility
- ZIGZAG
- MESA
- Retracement
- Aroon
INDICATORS LIST
LIST OF TOPICS
PRINT THIS ARTICLE
by Gary Grosschadl
The gold price challenged a previous high several weeks ago and promptly came back down. What patterns are evident?
Position: Hold
Gary Grosschadl
Independent Canadian equities trader and technical analyst based in Peterborough
Ontario, Canada.
PRINT THIS ARTICLE
CHART ANALYSIS
Gold Patterns
10/16/03 10:43:06 AMby Gary Grosschadl
The gold price challenged a previous high several weeks ago and promptly came back down. What patterns are evident?
Position: Hold
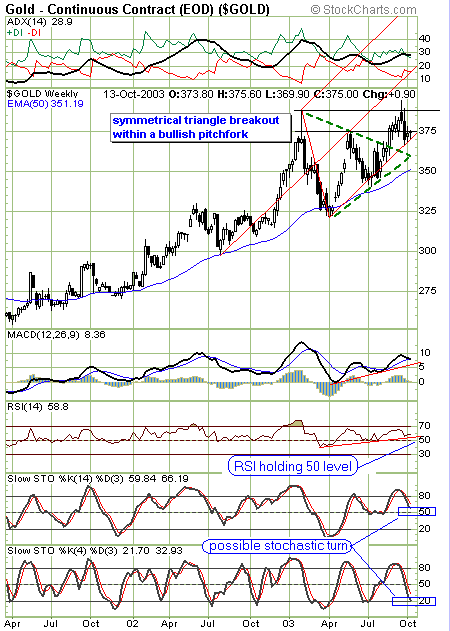
| Analyzing the weekly chart of Gold - Continuous Contract shows several pattern possibilities. This is what makes the volatile gold markets so challenging - the myriad of possibilities. There are several patterns contained in the overall pitchfork view. |
| The weekly chart shows a previous symmetrical triangle breakout move. Often with pattern breakouts, be they triangles or other patterns, the initial breakout can be countered with a throwback test. This is a test of the breakout area or close to it and is most times very telling as it either confirms the validity of the breakout or points to a pattern failure and a move back down. Here a move down to the initial breakout area of $368 is shown. Sometimes this test will occur at or near the apex of the triangle. |
|
| Weekly gold chart showing several patterns. |
| Graphic provided by: Stockcharts.com. |
| |
| This same move has now come down to test the lower pitchfork line, which shows promise of holding. This would be very bullish for a resumption of the gold uptrend. As far as other patterns evident...this can also be viewed as an ascending triangle with a top trendline drawn at $375. Or it might also be a double top attempt. Either way the pitchfork may be a good guide going forward. As long as the pitchfork's lower median line holds, the bullish intent stands for this volatile commodity until proven otherwise. |
| Several indicators displayed below the chart hint at bullish promise. The RSI (relative strength index) is a momentum oscillator that compares the magnitude of gains against the magnitude of losses. Holding the 50 level is often indicative of a bounce and shows underlying strength. Both stochastic series (one set for a shorter-term view) show a position at what are often turning points, the 50 or 20 level. |
Independent Canadian equities trader and technical analyst based in Peterborough
Ontario, Canada.
| Website: | www.whatsonsale.ca/financial.html |
| E-mail address: | gwg7@sympatico.ca |
Click here for more information about our publications!
PRINT THIS ARTICLE

Request Information From Our Sponsors
- StockCharts.com, Inc.
- Candle Patterns
- Candlestick Charting Explained
- Intermarket Technical Analysis
- John Murphy on Chart Analysis
- John Murphy's Chart Pattern Recognition
- John Murphy's Market Message
- MurphyExplainsMarketAnalysis-Intermarket Analysis
- MurphyExplainsMarketAnalysis-Visual Analysis
- StockCharts.com
- Technical Analysis of the Financial Markets
- The Visual Investor
- VectorVest, Inc.
- Executive Premier Workshop
- One-Day Options Course
- OptionsPro
- Retirement Income Workshop
- Sure-Fire Trading Systems (VectorVest, Inc.)
- Trading as a Business Workshop
- VectorVest 7 EOD
- VectorVest 7 RealTime/IntraDay
- VectorVest AutoTester
- VectorVest Educational Services
- VectorVest OnLine
- VectorVest Options Analyzer
- VectorVest ProGraphics v6.0
- VectorVest ProTrader 7
- VectorVest RealTime Derby Tool
- VectorVest Simulator
- VectorVest Variator
- VectorVest Watchdog