

HOT TOPICS LIST
- MACD
- Fibonacci
- RSI
- Gann
- ADXR
- Stochastics
- Volume
- Triangles
- Futures
- Cycles
- Volatility
- ZIGZAG
- MESA
- Retracement
- Aroon
INDICATORS LIST
LIST OF TOPICS
PRINT THIS ARTICLE
by Kevin Hopson
Magnum Hunter recently broke out of a bullish triangle formation, indicating the potential for higher prices in the near-term. However, I would be wary of a possible trend change once this breakout has been completed.
Position: Hold
Kevin Hopson
Kevin has been a technical analyst for roughly 10 years now. Previously, Kevin owned his own business and acted as a registered investment advisor, specializing in energy. He was also a freelance oil analyst for Orient Trading Co., a commodity futures trading firm in Japan. Kevin is currently a freelance writer.
PRINT THIS ARTICLE
TRIANGLES
Magnum Hunter's Triangle Breakout
10/14/03 07:56:57 AMby Kevin Hopson
Magnum Hunter recently broke out of a bullish triangle formation, indicating the potential for higher prices in the near-term. However, I would be wary of a possible trend change once this breakout has been completed.
Position: Hold
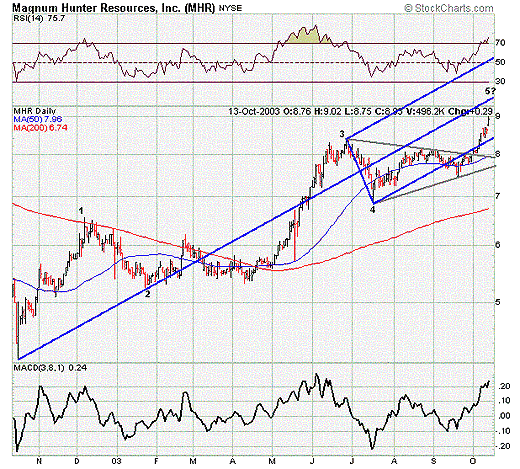
| Magnum Hunter Resources, Inc. (MHR) has been in a steady uptrend since last October, as the stock price has more than doubled over the past year. Despite the significant run-up in the last twelve months, there is the potential for higher prices in the near-term, the primary reason being this month's triangle breakout, as illustrated by the gray trendlines in the one-year chart. Since symmetrical triangles tend to be continuation patterns and the trend has been positive, a break to the upside was likely. |
| Now that this has occurred, it appears that Magnum Hunter could make its way up to the $9.60 level in the near-term. I calculated this price target by taking the base of the triangle ($8.40 - $6.80 = $1.60) and adding to the point of initial breakout ($8.00 + $1.60 = $9.60). However, it should be noted that triangle formations often occur during the final stages of a trend, whether it be an uptrend or a downtrend. Since Magnum Hunter has continued to move higher over the course of the past twelve months, the recent triangle breakout could indicate the final move of this long-term uptrend. |
|
| Graphic provided by: Stockcharts.com. |
| |
| Also supporting this theory is the Elliott Wave count. For example, it appears that Magnum Hunter is in the fifth and final wave of its long-term uptrend. The 0-3/4 pitchfork, which draws a line from the beginning of the trend through the middle of the third and fourth pivot points, is often an accurate indicator of where the trend will reverse. More specifically, prices should reverse at the blue median line. As you can see, the blue median line is converging around my ultimate price target ($9.60), which makes this an ideal spot for a trend reversal. Being the case, I would continue to hold shares of Magnum Hunter and sell into strength if the stock makes its way up to my price target. |
Kevin has been a technical analyst for roughly 10 years now. Previously, Kevin owned his own business and acted as a registered investment advisor, specializing in energy. He was also a freelance oil analyst for Orient Trading Co., a commodity futures trading firm in Japan. Kevin is currently a freelance writer.
| Glen Allen, VA | |
| E-mail address: | hopson_1@yahoo.com |
Click here for more information about our publications!
PRINT THIS ARTICLE

Request Information From Our Sponsors
- StockCharts.com, Inc.
- Candle Patterns
- Candlestick Charting Explained
- Intermarket Technical Analysis
- John Murphy on Chart Analysis
- John Murphy's Chart Pattern Recognition
- John Murphy's Market Message
- MurphyExplainsMarketAnalysis-Intermarket Analysis
- MurphyExplainsMarketAnalysis-Visual Analysis
- StockCharts.com
- Technical Analysis of the Financial Markets
- The Visual Investor
- VectorVest, Inc.
- Executive Premier Workshop
- One-Day Options Course
- OptionsPro
- Retirement Income Workshop
- Sure-Fire Trading Systems (VectorVest, Inc.)
- Trading as a Business Workshop
- VectorVest 7 EOD
- VectorVest 7 RealTime/IntraDay
- VectorVest AutoTester
- VectorVest Educational Services
- VectorVest OnLine
- VectorVest Options Analyzer
- VectorVest ProGraphics v6.0
- VectorVest ProTrader 7
- VectorVest RealTime Derby Tool
- VectorVest Simulator
- VectorVest Variator
- VectorVest Watchdog