

HOT TOPICS LIST
- MACD
- Fibonacci
- RSI
- Gann
- ADXR
- Stochastics
- Volume
- Triangles
- Futures
- Cycles
- Volatility
- ZIGZAG
- MESA
- Retracement
- Aroon
INDICATORS LIST
LIST OF TOPICS
PRINT THIS ARTICLE
by Matt Blackman
Every rally has its cycles. In a bull, prices move up for a period, take a rest and then continue to move higher. Its rest time again for the S&P 500 and traders are watching to see if it will be a brief catnap or deep slumber.
Position: Sell
Matt Blackman
Matt Blackman is a full-time technical and financial writer and trader. He produces corporate and financial newsletters, and assists clients in getting published in the mainstream media. He is the host of TradeSystemGuru.com. Matt has earned the Chartered Market Technician (CMT) designation. Find out what stocks and futures Matt is watching on Twitter at www.twitter.com/RatioTrade
PRINT THIS ARTICLE
CANDLESTICK CHARTING
Rest Time Again For The S&P 500
10/13/03 10:04:26 AMby Matt Blackman
Every rally has its cycles. In a bull, prices move up for a period, take a rest and then continue to move higher. Its rest time again for the S&P 500 and traders are watching to see if it will be a brief catnap or deep slumber.
Position: Sell
| It has been a bullish ride for the S&P 500 since March 11. The index has moved up nicely, retraced in an orderly fashion and then resumed its flight into higher altitudes. The first test came last March when the index retraced 50%. Since then, each retracement has been less than the first Fibonacci level of 23.8% indicating that the buyers have been very much in control, buying on each retracement. |
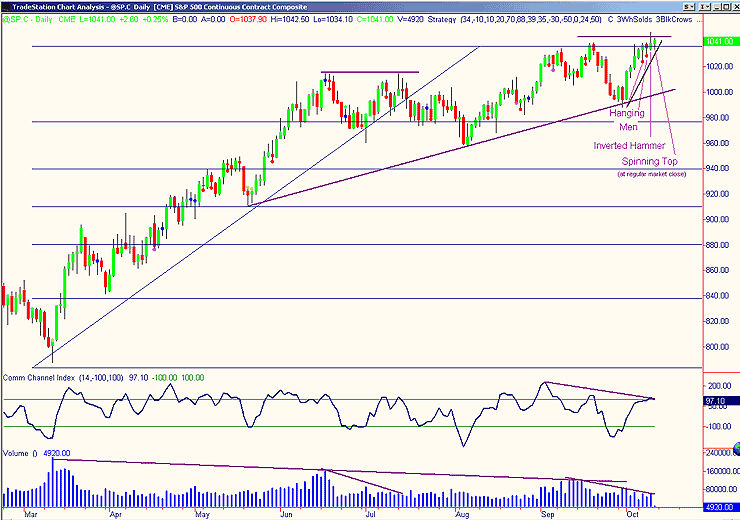
| Momentum oscillators have, for the most part, been stuck above 50. The commodity channel index (CCI), has given only two buy signals since March 11 (Figure 1). But it has also worked well, together with volume, in warning of divergence and potential retracements, which savvy traders have used to take profits. The first such signal was between mid-April and mid-May. Next, a divergence occurred between the end of May and mid-June and a third between mid-June and mid-July, which lasted into August when the index dropped from 1015 to 960. Since mid-July, the bull trendline has been flattening causing participants to wonder if at last the long-awaited bull is getting tired. The latest move up that began in late September witnessed a move from 990 to a high of 1040. But there are a number of indications that this time may slumber rather than nap. From the 8th of August to the 19th of September, the S&P 500 moved 65 points but then gave back 44 points or 61.8% in the last retracement indicating that the rally may indeed be tiring. The latest run is looking tired and has shown an number of bearish candlestick patterns including two hanging men, an inverted hammer and a spinning top (if aftermarket action on October 10th is excluded). There is also negative divergence between price and volume as well as in the CCI. |
|
| Figure 1: Daily chart of S&P 500 futures (SP.C) showing market action from early March to the second week of October. Note the steadily declining volume and clear negative divergence between price and the CCI (middle window). With each retracement, volume showed a noticeable drop, coinciding with CCI divergence. Blue horizontal lines are Fibonacci retracement levels between the pivot low March 11 and pivot high to mid-September. |
| Graphic provided by: TradeStation. |
| |
| Technically speaking, it appears to be an excellent time to take profits and await new signs that the bull is waking up and ready to continue its upward march. However, traders should be cognizant to the possibility that a major retracement could be in store, especially with the onset of negative earnings or economic news. There are a number of seriously injured bears hiding in the woods that would like nothing more than to be able to jump in to recover painful losses sustained over the last seven months. |
Matt Blackman is a full-time technical and financial writer and trader. He produces corporate and financial newsletters, and assists clients in getting published in the mainstream media. He is the host of TradeSystemGuru.com. Matt has earned the Chartered Market Technician (CMT) designation. Find out what stocks and futures Matt is watching on Twitter at www.twitter.com/RatioTrade
| Company: | TradeSystemGuru.com |
| Address: | Box 2589 |
| Garibaldi Highlands, BC Canada | |
| Phone # for sales: | 604-898-9069 |
| Fax: | 604-898-9069 |
| Website: | www.tradesystemguru.com |
| E-mail address: | indextradermb@gmail.com |
Traders' Resource Links | |
| TradeSystemGuru.com has not added any product or service information to TRADERS' RESOURCE. | |
Click here for more information about our publications!
Comments
Date:�10/22/03Rank:�3Comment:�

Request Information From Our Sponsors
- StockCharts.com, Inc.
- Candle Patterns
- Candlestick Charting Explained
- Intermarket Technical Analysis
- John Murphy on Chart Analysis
- John Murphy's Chart Pattern Recognition
- John Murphy's Market Message
- MurphyExplainsMarketAnalysis-Intermarket Analysis
- MurphyExplainsMarketAnalysis-Visual Analysis
- StockCharts.com
- Technical Analysis of the Financial Markets
- The Visual Investor
- VectorVest, Inc.
- Executive Premier Workshop
- One-Day Options Course
- OptionsPro
- Retirement Income Workshop
- Sure-Fire Trading Systems (VectorVest, Inc.)
- Trading as a Business Workshop
- VectorVest 7 EOD
- VectorVest 7 RealTime/IntraDay
- VectorVest AutoTester
- VectorVest Educational Services
- VectorVest OnLine
- VectorVest Options Analyzer
- VectorVest ProGraphics v6.0
- VectorVest ProTrader 7
- VectorVest RealTime Derby Tool
- VectorVest Simulator
- VectorVest Variator
- VectorVest Watchdog