HOT TOPICS LIST
- MACD
- Fibonacci
- RSI
- Gann
- ADXR
- Stochastics
- Volume
- Triangles
- Futures
- Cycles
- Volatility
- ZIGZAG
- MESA
- Retracement
- Aroon
INDICATORS LIST
LIST OF TOPICS
PRINT THIS ARTICLE
by David Penn
After breaking out from an ascending triangle in early September, December gold finds itself back where the breakout began.
Position: N/A
David Penn
Technical Writer for Technical Analysis of STOCKS & COMMODITIES magazine, Working-Money.com, and Traders.com Advantage.
PRINT THIS ARTICLE
BREAKOUTS
December Gold's Post-Breakout Blues
10/13/03 09:14:45 AMby David Penn
After breaking out from an ascending triangle in early September, December gold finds itself back where the breakout began.
Position: N/A
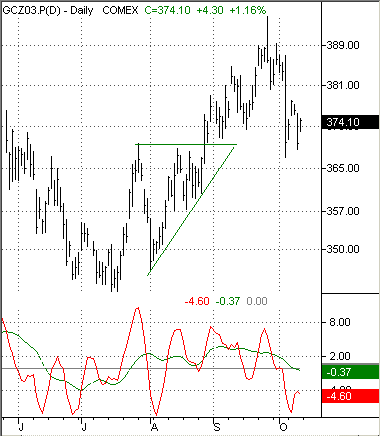
| Is $400 gold in our immediate future? With the breakout from an ascending triangle in September, more than a few gold bulls thought that future had arrived. The ascending triangle was traced out of the higher lows gold futures (basis December) began making early in August after gold finished a relatively mild correction from the May highs of 376 to the July lows of 342. As the chart of December gold futures shows, the market became extremely oversold in early August and the rally that ensued was largely a response to this oversold condition. |
| December gold broke out above support at 370 late in August. This was a perfect, "don't look back" breakout for gold, which moved up, tested the breakout level, but never traded below it as it advanced from 370 on August 27 to over 394 in about one month. The fact that December gold climbed as high as 394 is particularly significant insofar as this matches exactly the projection from the August ascending triangle (i.e., value at top of formation - value at lowest point in formation + value at top of formation = target price, or 370 - 346 = 24, 370 + 24 = 394, respectively). |

|
| Figure 1: The breakout giveth and taketh away ... After reaching this ascending triangle's target upside, December gold fell right back to the breakout level. |
| Graphic provided by: TradeStation. |
| |
| Where does gold go from these levels? Right now, gold is holding up at precisely the breakout level from August -- i.e., 370. If support holds here, then there is every reason to believe that gold will advance. The market, as shown by Bradford Raschke's 3/10 oscillator, suggests that December gold is as oversold as it was in early August, when it proceeded to go on a run of more than 40 points. What is worth watching in the short-term is whether the fast line (red) in the oscillator continues to round over and converge with the downwardly sloped slower line (green). Such a development would suggest a short-term move back to the downside (see Bradford Raschke's Street Smarts for more on using the 3/10 oscillator in this fashion). |
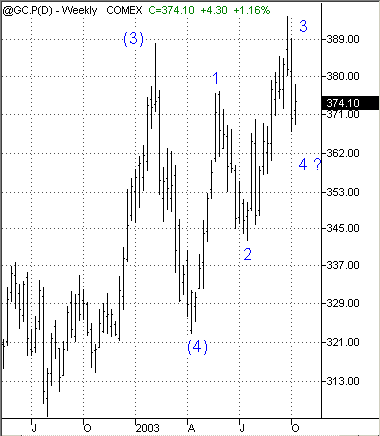
 Figure 2: Could this leg of the gold bull market end in an Elliott wave diagonal triangle? A continued correction in December gold might be just the thing to propel the gold price back to its $400-testing ways. There is an argument that gold's rally from the April lows has begun an Elliott Wave-esque diagonal triangle to the upside. For a refresher -- and for those unfamiliar with EW diagonal triangles -- here is an excerpt from Frost and Prechter's Elliott Wave Principle: "Diagonal triangles occur in fifth wave positions, usually after the preceding move has gone 'too far too fast,' as Elliott put it. They are a special type of fifth wave which indicate exhaustion of the larger movement. Diagonal triangles are essentially wedges formed by two converging lines, with each subwave, including the impulse waves, subdividing into a 'three' . . ." "Too far too fast" is a pretty subjective call to make. But the move upward from the late 2001 lows near 275 to the early 2003 highs at 390 represent a gain of over 40% in approximately one year. These are the sort of annual gains that are more common in bear market rallies (the Nasdaq Composite from the October 2002 lows to present is up some 72%--1108 to 1915; the S&P 500 is up some 35% over the same period) than in bull markets. So there may be a "too far too fast" case to be made in gold's furious advance. |
| If gold is in a fifth wave advance, then there remains no telling just how far an advance might take prices -- even if we recognize that a fifth wave represents the final upside move before a significant correction ("significant" meaning proportionate to the size of the previous advance). But it may be the case that, in the intermediate term, the interests of gold traders and gold investors might begin to diverge for the first time since gold began its move off the lows more than two years. |
Technical Writer for Technical Analysis of STOCKS & COMMODITIES magazine, Working-Money.com, and Traders.com Advantage.
| Title: | Technical Writer |
| Company: | Technical Analysis, Inc. |
| Address: | 4757 California Avenue SW |
| Seattle, WA 98116 | |
| Phone # for sales: | 206 938 0570 |
| Fax: | 206 938 1307 |
| Website: | www.Traders.com |
| E-mail address: | DPenn@traders.com |
Traders' Resource Links | |
| Charting the Stock Market: The Wyckoff Method -- Books | |
| Working-Money.com -- Online Trading Services | |
| Traders.com Advantage -- Online Trading Services | |
| Technical Analysis of Stocks & Commodities -- Publications and Newsletters | |
| Working Money, at Working-Money.com -- Publications and Newsletters | |
| Traders.com Advantage -- Publications and Newsletters | |
| Professional Traders Starter Kit -- Software | |
Click here for more information about our publications!
PRINT THIS ARTICLE

Request Information From Our Sponsors
- StockCharts.com, Inc.
- Candle Patterns
- Candlestick Charting Explained
- Intermarket Technical Analysis
- John Murphy on Chart Analysis
- John Murphy's Chart Pattern Recognition
- John Murphy's Market Message
- MurphyExplainsMarketAnalysis-Intermarket Analysis
- MurphyExplainsMarketAnalysis-Visual Analysis
- StockCharts.com
- Technical Analysis of the Financial Markets
- The Visual Investor
- VectorVest, Inc.
- Executive Premier Workshop
- One-Day Options Course
- OptionsPro
- Retirement Income Workshop
- Sure-Fire Trading Systems (VectorVest, Inc.)
- Trading as a Business Workshop
- VectorVest 7 EOD
- VectorVest 7 RealTime/IntraDay
- VectorVest AutoTester
- VectorVest Educational Services
- VectorVest OnLine
- VectorVest Options Analyzer
- VectorVest ProGraphics v6.0
- VectorVest ProTrader 7
- VectorVest RealTime Derby Tool
- VectorVest Simulator
- VectorVest Variator
- VectorVest Watchdog
