HOT TOPICS LIST
- MACD
- Fibonacci
- RSI
- Gann
- ADXR
- Stochastics
- Volume
- Triangles
- Futures
- Cycles
- Volatility
- ZIGZAG
- MESA
- Retracement
- Aroon
INDICATORS LIST
LIST OF TOPICS
PRINT THIS ARTICLE
by David Penn
A three and a half month trading range in the regional banks HOLDRs leads to a move up as earning season begins.
Position: N/A
David Penn
Technical Writer for Technical Analysis of STOCKS & COMMODITIES magazine, Working-Money.com, and Traders.com Advantage.
PRINT THIS ARTICLE
BREAKOUTS
Banks Break Out
10/10/03 11:34:26 AMby David Penn
A three and a half month trading range in the regional banks HOLDRs leads to a move up as earning season begins.
Position: N/A
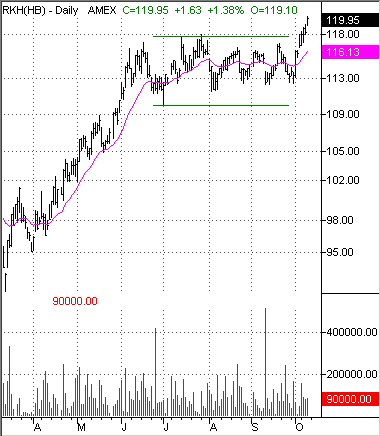
| Back near the end of August, I suggested that the regional banks -- as represented by the RKH HOLDRs -- were vulnerable to a correction ("Bye, Bye Banks?", Traders.com Advantage, August 29, 2003). The evidence for this was two-fold: for one, I thought that the sector rotation of the business cycle pointed toward a move away from those sectors that tend to outperform at the beginning of the business cycle (i.e., financials). My second reason was the developing head and shoulders top in the RKH itself -- a head and shoulders top that necessitated a breakdown beneath 111 or so in order to be valid. |
| The fact that RKH did not break down as September began and, instead turned its head and shoulders top into a choppy trading range, suggests that even if a sector finds itself unfavored in the business cycle, that doesn't necessarily mean that it will suffer significant declines in the stock market. If my sense of the business cycle is correct, then it is perfectly reasonable for RKH to move sideways late into an expansionary period, as opposed to correcting sharply lower. |

|
| Figure 1: Regional banks break out in October from a three and a half month trading range. |
| Graphic provided by: TradeStation. |
| |
| Breaking out at just under 118 on October 6th, the RKH moved up as high as 120 later in the week. The chief negative against the breakout is that it has not yet been accompanied by high volume. In fact, some of the component stocks of the RKH (Fleet Boston Financial, Wachovia Corporation) have actually experienced declining volume during this breakout move. Nevertheless, there appears to be underlying strength in the market (the S&P 500, Dow Industrials and Dow Transports all featured similar breakouts to the upside). There is also evidence that strong selling early in September (note the volume spike shown in Figure 1) may have exhausted itself, paving the way for a new offensive from the buyers. Given the size of the trading range (approximately $6), an initial move to as high as $124 in the RKH is a reasonable expectation should the breakout hold. |
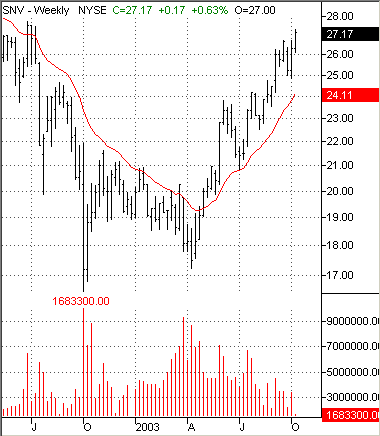
 Figure 2: Synovus Financial has been one of the particularly well-performing regional banks in the second half of 2003. Among the more interesting regional bank stocks that are moving up strongly at this time are Wells Fargo (WFC), Synovus Financial (SNV), and Northern Trust (NTRS). The latter two may be especially worth watching, as their breakouts are resulting in new 52-week highs. At $46, for example, Northern Trust is trading higher than it has at any point since the summer of 2002. |
Technical Writer for Technical Analysis of STOCKS & COMMODITIES magazine, Working-Money.com, and Traders.com Advantage.
| Title: | Technical Writer |
| Company: | Technical Analysis, Inc. |
| Address: | 4757 California Avenue SW |
| Seattle, WA 98116 | |
| Phone # for sales: | 206 938 0570 |
| Fax: | 206 938 1307 |
| Website: | www.Traders.com |
| E-mail address: | DPenn@traders.com |
Traders' Resource Links | |
| Charting the Stock Market: The Wyckoff Method -- Books | |
| Working-Money.com -- Online Trading Services | |
| Traders.com Advantage -- Online Trading Services | |
| Technical Analysis of Stocks & Commodities -- Publications and Newsletters | |
| Working Money, at Working-Money.com -- Publications and Newsletters | |
| Traders.com Advantage -- Publications and Newsletters | |
| Professional Traders Starter Kit -- Software | |
Click here for more information about our publications!
Comments
Date: 10/12/03Rank: Comment: I think it was not head shoulder pattern as thought earlier, it can be consilidation prior to breakout. As I am a trader in Pakistani market, I donot have complete chart of RKH . Before concluding that it would be a head shoulder pattern, we should also note previous consolidations (duration width) also noting gap between consective consolidations with special attentions on higher bottom counts.
Thank you,
Sincerely,
Dr.Khalid Masood Karim
E-Mail: dr_khalidmasood@yahoo.com

Request Information From Our Sponsors
- StockCharts.com, Inc.
- Candle Patterns
- Candlestick Charting Explained
- Intermarket Technical Analysis
- John Murphy on Chart Analysis
- John Murphy's Chart Pattern Recognition
- John Murphy's Market Message
- MurphyExplainsMarketAnalysis-Intermarket Analysis
- MurphyExplainsMarketAnalysis-Visual Analysis
- StockCharts.com
- Technical Analysis of the Financial Markets
- The Visual Investor
- VectorVest, Inc.
- Executive Premier Workshop
- One-Day Options Course
- OptionsPro
- Retirement Income Workshop
- Sure-Fire Trading Systems (VectorVest, Inc.)
- Trading as a Business Workshop
- VectorVest 7 EOD
- VectorVest 7 RealTime/IntraDay
- VectorVest AutoTester
- VectorVest Educational Services
- VectorVest OnLine
- VectorVest Options Analyzer
- VectorVest ProGraphics v6.0
- VectorVest ProTrader 7
- VectorVest RealTime Derby Tool
- VectorVest Simulator
- VectorVest Variator
- VectorVest Watchdog
