HOT TOPICS LIST
- MACD
- Fibonacci
- RSI
- Gann
- ADXR
- Stochastics
- Volume
- Triangles
- Futures
- Cycles
- Volatility
- ZIGZAG
- MESA
- Retracement
- Aroon
INDICATORS LIST
LIST OF TOPICS
PRINT THIS ARTICLE
by Gary Grosschadl
As the markets surged upwards last week many traders were anticipating the USD to follow with its own bounce.
Position: N/A
Gary Grosschadl
Independent Canadian equities trader and technical analyst based in Peterborough
Ontario, Canada.
PRINT THIS ARTICLE
CHART ANALYSIS
Can The U.S. Dollar Index Make An Upleg?
10/07/03 11:46:40 AMby Gary Grosschadl
As the markets surged upwards last week many traders were anticipating the USD to follow with its own bounce.
Position: N/A
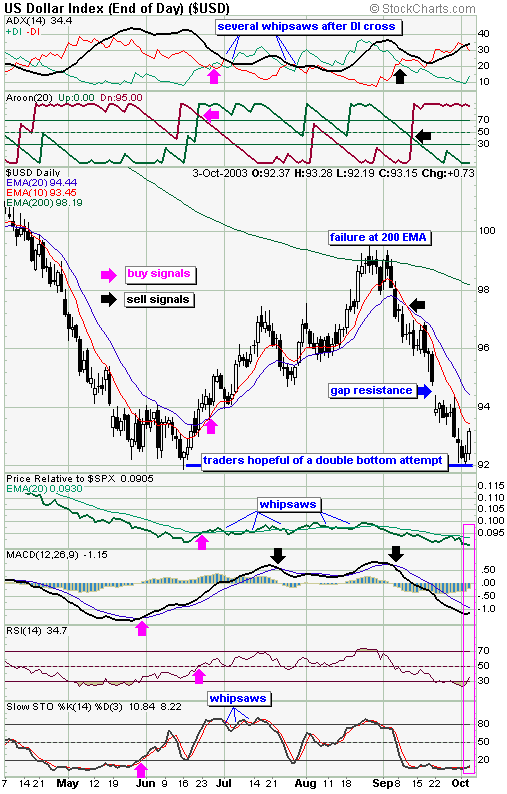
| Last Friday the USD did make a bullish move and gold traders took the brunt of it as the price of gold plunged nearly $14 (a six year record). Some traders are likely hoping for a double bottom attempt on this daily chart of the USD but taking a closer look at some technicals brings a more sobering view. |
| Last June it took several weeks for a bounce off the bottom to occur and several signals verified that the upmove finally happened. The magenta arrows show where these occured. From top to bottom they are: DI crossover on the directional movement indicator, an Aroon 20 cross, a 10/20 moving average cross, a price relative to $SPX crossover, a MACD (moving average convergence/divergence) crossover, RSI (relative strength index) moving above the 50 level, and lastly a stochastic move above the 20 region. |

|
| Daily chart of the U.S. Dollar Index. |
| Graphic provided by: Stockcharts.com. |
| |
| Presently none of these signals have yet to be triggered so the move up has yet to be convincing. Also note the gap resistance at 94.4. There is likely to be significant resistance at this point again. So even if the USD manages to move up, it may not amount to much of a run. |
| Traders should not read too much into this very early upturn as it may not last. Repercussions could include another bearish reversal for the main equities indices and possibly a bullish reversal for the gold sector. Further proof is required that this potential bullish run has any staying power. The markets remain volatile and reversal oriented as they have been for quite some time. |
Independent Canadian equities trader and technical analyst based in Peterborough
Ontario, Canada.
| Website: | www.whatsonsale.ca/financial.html |
| E-mail address: | gwg7@sympatico.ca |
Click here for more information about our publications!
Comments
Date: 10/08/03Rank: 4Comment:

Request Information From Our Sponsors
- StockCharts.com, Inc.
- Candle Patterns
- Candlestick Charting Explained
- Intermarket Technical Analysis
- John Murphy on Chart Analysis
- John Murphy's Chart Pattern Recognition
- John Murphy's Market Message
- MurphyExplainsMarketAnalysis-Intermarket Analysis
- MurphyExplainsMarketAnalysis-Visual Analysis
- StockCharts.com
- Technical Analysis of the Financial Markets
- The Visual Investor
- VectorVest, Inc.
- Executive Premier Workshop
- One-Day Options Course
- OptionsPro
- Retirement Income Workshop
- Sure-Fire Trading Systems (VectorVest, Inc.)
- Trading as a Business Workshop
- VectorVest 7 EOD
- VectorVest 7 RealTime/IntraDay
- VectorVest AutoTester
- VectorVest Educational Services
- VectorVest OnLine
- VectorVest Options Analyzer
- VectorVest ProGraphics v6.0
- VectorVest ProTrader 7
- VectorVest RealTime Derby Tool
- VectorVest Simulator
- VectorVest Variator
- VectorVest Watchdog
