HOT TOPICS LIST
- MACD
- Fibonacci
- RSI
- Gann
- ADXR
- Stochastics
- Volume
- Triangles
- Futures
- Cycles
- Volatility
- ZIGZAG
- MESA
- Retracement
- Aroon
INDICATORS LIST
LIST OF TOPICS
PRINT THIS ARTICLE
by Gary Grosschadl
For a lasting economic turnaround, many hope for cheaper oil prices to act as a catalyst. Here is a plausible chart view to sustain the above notion.
Position: N/A
Gary Grosschadl
Independent Canadian equities trader and technical analyst based in Peterborough
Ontario, Canada.
PRINT THIS ARTICLE
ANDREWS PITCH-FORK
A Theory Of $20 Oil Or Lower
10/06/03 08:28:56 AMby Gary Grosschadl
For a lasting economic turnaround, many hope for cheaper oil prices to act as a catalyst. Here is a plausible chart view to sustain the above notion.
Position: N/A
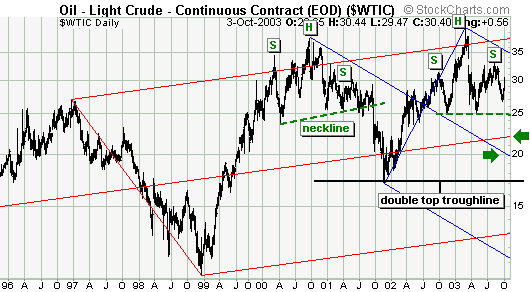
| This daily chart reaches back nine years to obtain the first pivot point for the Andrews Pitchfork but I shortened the chart for clarity. I will discuss the two pitchforks shown on the chart before moving on to pattern analysis. |
| Andrews Pitchfork or Andrews Median Line uses prominent pivot points or turning points as a basis for drawing the parallel median lines. Once drawn (most often using software drawing tools) there are some basic theories of line behavior, the main one being that a majority of the time (80%) a bounce off either the top or bottom pitchfork extremity returns to the center median line. The longer-term red pitchfork illustrates this move to the median line. The move to the center median line is bullish, the move past that line to the upper median line is extremely bullish. Often the move to the center median line is a topping out move and the stock/index/commodity heads back down. The topping action, in the form of a head and shoulders pattern, resulted in a move back down to the median line. Note on both occasions that the stock overshot the applicable pitchfork line. After dipping down to $17 (an unsustainable low), oil eventually returned to the top pitchfork line. |

|
| A longer-term look at oil shows a possible double top with median line targets hinting at $20 oil price. |
| Graphic provided by: Stockcharts.com. |
| |
| An interesting pattern in the form of another head and shoulders pattern with a neckline at $25 seems to have developed. However the longer-term pitchfork in red points upwards and suggests that the trend is still up until the median line is violated. |
| This takes us to the shorter-term pitchfork in blue using the more recent major pivot points. Here we see the fork pointing bearishly down. Unless the top line is violated at $35 (currently), the trend remains down. Note a move to either center median line has a target zone of $20 - 22 barring an overshoot. |
| There is another pattern worth mentioning. There could be a large double top in the making with both tops coming in the form of a head and shoulder pattern. A support test of the troughline would have oil coming down to $17. Would this be another unsustainable low or a sign of still lower oil coming? Low oil prices would be a blessing to most world economies but what would be the catalyst? A huge oil find perhaps in the North Sea or off the Canadian east coast, or new technology in the form of a fuel cell breakthrough are just a few of many possibilities. |
Independent Canadian equities trader and technical analyst based in Peterborough
Ontario, Canada.
| Website: | www.whatsonsale.ca/financial.html |
| E-mail address: | gwg7@sympatico.ca |
Click here for more information about our publications!
Comments
Date: 10/07/03Rank: 4Comment:
Date: 10/08/03Rank: 4Comment:

Request Information From Our Sponsors
- StockCharts.com, Inc.
- Candle Patterns
- Candlestick Charting Explained
- Intermarket Technical Analysis
- John Murphy on Chart Analysis
- John Murphy's Chart Pattern Recognition
- John Murphy's Market Message
- MurphyExplainsMarketAnalysis-Intermarket Analysis
- MurphyExplainsMarketAnalysis-Visual Analysis
- StockCharts.com
- Technical Analysis of the Financial Markets
- The Visual Investor
- VectorVest, Inc.
- Executive Premier Workshop
- One-Day Options Course
- OptionsPro
- Retirement Income Workshop
- Sure-Fire Trading Systems (VectorVest, Inc.)
- Trading as a Business Workshop
- VectorVest 7 EOD
- VectorVest 7 RealTime/IntraDay
- VectorVest AutoTester
- VectorVest Educational Services
- VectorVest OnLine
- VectorVest Options Analyzer
- VectorVest ProGraphics v6.0
- VectorVest ProTrader 7
- VectorVest RealTime Derby Tool
- VectorVest Simulator
- VectorVest Variator
- VectorVest Watchdog
