HOT TOPICS LIST
- MACD
- Fibonacci
- RSI
- Gann
- ADXR
- Stochastics
- Volume
- Triangles
- Futures
- Cycles
- Volatility
- ZIGZAG
- MESA
- Retracement
- Aroon
INDICATORS LIST
LIST OF TOPICS
PRINT THIS ARTICLE
by Gary Grosschadl
This well known tech stock trades on both sides of the border and is nearing what may be crucial support.
Position: N/A
Gary Grosschadl
Independent Canadian equities trader and technical analyst based in Peterborough
Ontario, Canada.
PRINT THIS ARTICLE
CHART ANALYSIS
Celestica Searching For Support
10/02/03 08:27:22 AMby Gary Grosschadl
This well known tech stock trades on both sides of the border and is nearing what may be crucial support.
Position: N/A
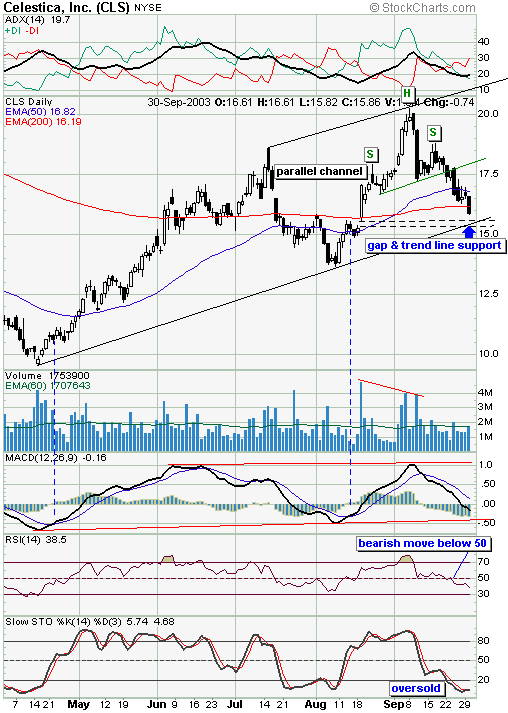
| This daily chart suggests Celestica (CLS) is in a rising channel, however more trendline touches would make for a more convincing channel. Failure at the top of the channel occurred via a shooting star candlestick which was part of a larger pattern -- a head and shoulders top. Note the correct volume signature with lower volume at the head versus the formation of the left shoulder. The slanted neckline also matches the slope of the channel trendlines, giving some interesting symmetry. |
| I never like to see a stock move below its 200-period EMA, however in this case the stock is nearing likely support as shown on the chart. As there is a previous gap near the trendline, a bounce could occur. It may be prudent to watch the outcome before getting too bearish on the stock. |

|
| Celestica's daily chart shows an approaching test. |
| Graphic provided by: Stockcharts.com. |
| |
| Several indicators also may be ready to turn bullish. The stochastics are in oversold territory and a move above the 20 area may signal an upleg beginning. Likewise the MACD (moving average convergence/divergence) hints at a possible turn developing soon. Note that traders were rewarded on prior occasions by waiting for a bullish crossover of the MACD lines. |
| A bounce soon would not be a surprise. Upside resistance will have to be monitored at the 200-period EMA as failure there could send the stock back down again. But success there brings the possibility of another test at the 20-day EMA, currently at $16.82. |
Independent Canadian equities trader and technical analyst based in Peterborough
Ontario, Canada.
| Website: | www.whatsonsale.ca/financial.html |
| E-mail address: | gwg7@sympatico.ca |
Click here for more information about our publications!
PRINT THIS ARTICLE

|

Request Information From Our Sponsors
- StockCharts.com, Inc.
- Candle Patterns
- Candlestick Charting Explained
- Intermarket Technical Analysis
- John Murphy on Chart Analysis
- John Murphy's Chart Pattern Recognition
- John Murphy's Market Message
- MurphyExplainsMarketAnalysis-Intermarket Analysis
- MurphyExplainsMarketAnalysis-Visual Analysis
- StockCharts.com
- Technical Analysis of the Financial Markets
- The Visual Investor
- VectorVest, Inc.
- Executive Premier Workshop
- One-Day Options Course
- OptionsPro
- Retirement Income Workshop
- Sure-Fire Trading Systems (VectorVest, Inc.)
- Trading as a Business Workshop
- VectorVest 7 EOD
- VectorVest 7 RealTime/IntraDay
- VectorVest AutoTester
- VectorVest Educational Services
- VectorVest OnLine
- VectorVest Options Analyzer
- VectorVest ProGraphics v6.0
- VectorVest ProTrader 7
- VectorVest RealTime Derby Tool
- VectorVest Simulator
- VectorVest Variator
- VectorVest Watchdog
