HOT TOPICS LIST
- MACD
- Fibonacci
- RSI
- Gann
- ADXR
- Stochastics
- Volume
- Triangles
- Futures
- Cycles
- Volatility
- ZIGZAG
- MESA
- Retracement
- Aroon
INDICATORS LIST
LIST OF TOPICS
PRINT THIS ARTICLE
by Gary Grosschadl
The Walt Disney Co. (DIS) has failed several challenges on this daily chart and is now facing a test of its moving averages.
Position: N/A
Gary Grosschadl
Independent Canadian equities trader and technical analyst based in Peterborough
Ontario, Canada.
PRINT THIS ARTICLE
MOVING AVERAGES
Walt Disney Faces Key Challenges
10/02/03 08:00:33 AMby Gary Grosschadl
The Walt Disney Co. (DIS) has failed several challenges on this daily chart and is now facing a test of its moving averages.
Position: N/A
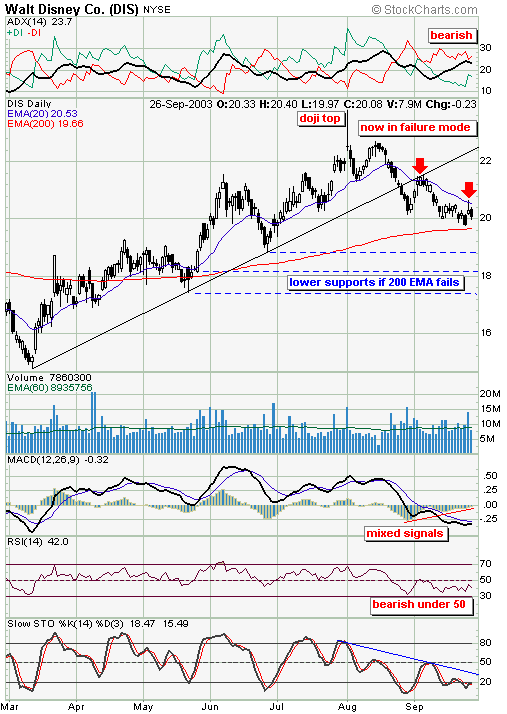
| Disney has had a bearish trend change but now is too close to an important support test to warrant a sell or short position just yet. The first sign of trouble occured with a doji candlestick marking a top last August. Dojis often mark turning points after extended moves in either direction. |
| After an unsuccessful attempt to beat that doji top, the stock fell below its 20-day EMA and then cracked trendline support. Support was found just above $20 and the stock retested the trendline only to fail again. This would have provided aggressive traders an opportunity to try shorting the stock. |

|
| DIS daily chart shows challenges ahead. |
| Graphic provided by: Stockcharts.com. |
| |
| When a stock breaks below trendline support and then also finds itself below its 20-day EMA (as in this case), I consider the stock to be in failure mode until it redeems itself. Redemption comes with a sustained move back above its EMA line. |
| The stock again tested support at $20 and may have found a temporary respite, however a bearish shooting star candlestick marked another failure at this 20-day EMA line. I would advise a sell here or even a short but the proximity of the ever important 200-period EMA is too close for comfort. An important move should soon transpire which will make for an easier trading decision. Either the stock overcomes its failure mode by rising and staying above its 20-day EMA overhead resistance or it fails a crucial support test at its 200-period EMA. One could also make a case for a head and shoulders type of failure here with the neckline at $20. |
| Failure brings several lower targets into play as marked by the dashed lines. The displayed indicators are mainly bearish however the MACD (moving average convergence/divergence) shows its histogram with a positive divergence which can lead to a bullish crossover for this indicator. So the most prudent play here is to wait for the outcome of the coming test of these moving averages. |
Independent Canadian equities trader and technical analyst based in Peterborough
Ontario, Canada.
| Website: | www.whatsonsale.ca/financial.html |
| E-mail address: | gwg7@sympatico.ca |
Click here for more information about our publications!
PRINT THIS ARTICLE

Request Information From Our Sponsors
- StockCharts.com, Inc.
- Candle Patterns
- Candlestick Charting Explained
- Intermarket Technical Analysis
- John Murphy on Chart Analysis
- John Murphy's Chart Pattern Recognition
- John Murphy's Market Message
- MurphyExplainsMarketAnalysis-Intermarket Analysis
- MurphyExplainsMarketAnalysis-Visual Analysis
- StockCharts.com
- Technical Analysis of the Financial Markets
- The Visual Investor
- VectorVest, Inc.
- Executive Premier Workshop
- One-Day Options Course
- OptionsPro
- Retirement Income Workshop
- Sure-Fire Trading Systems (VectorVest, Inc.)
- Trading as a Business Workshop
- VectorVest 7 EOD
- VectorVest 7 RealTime/IntraDay
- VectorVest AutoTester
- VectorVest Educational Services
- VectorVest OnLine
- VectorVest Options Analyzer
- VectorVest ProGraphics v6.0
- VectorVest ProTrader 7
- VectorVest RealTime Derby Tool
- VectorVest Simulator
- VectorVest Variator
- VectorVest Watchdog
