HOT TOPICS LIST
- MACD
- Fibonacci
- RSI
- Gann
- ADXR
- Stochastics
- Volume
- Triangles
- Futures
- Cycles
- Volatility
- ZIGZAG
- MESA
- Retracement
- Aroon
INDICATORS LIST
LIST OF TOPICS
PRINT THIS ARTICLE
by Koos van der Merwe
Support and resistance levels on a chart can be excellent areas to place buy or sell signals. They should not be confused with trendlines that connect the lows or highs of a trending range. Here is a chart of the S&P 500 Daily Index and various "lines" that can be useful.
Position: Hold
Koos van der Merwe
Has been a technical analyst since 1969, and has worked as a futures and options trader with First Financial Futures in Johannesburg, South Africa.
PRINT THIS ARTICLE
SUPPORT & RESISTANCE
The S&P 500 And Its Lines
09/30/03 08:48:22 AMby Koos van der Merwe
Support and resistance levels on a chart can be excellent areas to place buy or sell signals. They should not be confused with trendlines that connect the lows or highs of a trending range. Here is a chart of the S&P 500 Daily Index and various "lines" that can be useful.
Position: Hold
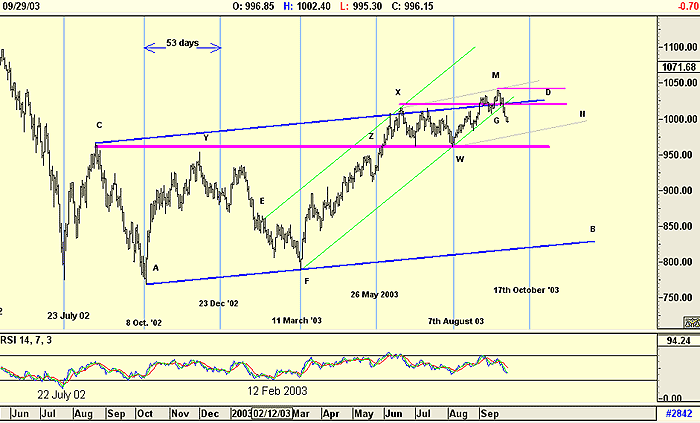
| Looking at the chart below, the first thing you may notice are the vertical lines. These are 53-day cycle lines and they appear to be holding up rather well, calling for the next cycle low on October 17th. |
| Next are the main support and resistance trendlines. These are AB and CD respectively, drawn in blue. The index, in rising from the low of October 8th, tested this level at Y, then fell back to its support at F. This occured at the cycle low on March 11th. |

|
| The S&P 500 Index and its lines. |
| Graphic provided by: AdvancedGET. |
| |
| In rising from its cycle low, the Index anticipated the resistance level CYZ, met its cycle low on the 26th of May, and then broke above the resistance level without any difficulty at Z. It tested the main resistance trendline CD, breaking above it slightly before falling back. It turned the resistance level YZW into support, and found the cycle low of August 7 at "W." |
| The support line "FW" (green) was then drawn, connecting the lows of a rising trend with its parallel EX (green) top, forming a rising trend channel. This appeared a logical move as the index broke above its resistance trendline, forming a high at M, before breaking down at "G." |
| Connecting the highs X and M, I then drew support line WN, (light grey) suggesting that there could be interim support before the price breaks below to test the support level CYZW once again. Resistance levels have also been drawn from X and M. These could be tested as the price rises following the cycle low of October 17, and if it breaks above the resistance trendline CD. |
Has been a technical analyst since 1969, and has worked as a futures and options trader with First Financial Futures in Johannesburg, South Africa.
| Address: | 3256 West 24th Ave |
| Vancouver, BC | |
| Phone # for sales: | 6042634214 |
| E-mail address: | petroosp@gmail.com |
Click here for more information about our publications!
Comments
Date: 10/01/03Rank: 2Comment:
Date: 10/04/03Rank: 5Comment: i need articles obt trendlines of s@p500 .
Date: 10/07/03Rank: 5Comment:
Date: 10/08/03Rank: 4Comment:

Request Information From Our Sponsors
- StockCharts.com, Inc.
- Candle Patterns
- Candlestick Charting Explained
- Intermarket Technical Analysis
- John Murphy on Chart Analysis
- John Murphy's Chart Pattern Recognition
- John Murphy's Market Message
- MurphyExplainsMarketAnalysis-Intermarket Analysis
- MurphyExplainsMarketAnalysis-Visual Analysis
- StockCharts.com
- Technical Analysis of the Financial Markets
- The Visual Investor
- VectorVest, Inc.
- Executive Premier Workshop
- One-Day Options Course
- OptionsPro
- Retirement Income Workshop
- Sure-Fire Trading Systems (VectorVest, Inc.)
- Trading as a Business Workshop
- VectorVest 7 EOD
- VectorVest 7 RealTime/IntraDay
- VectorVest AutoTester
- VectorVest Educational Services
- VectorVest OnLine
- VectorVest Options Analyzer
- VectorVest ProGraphics v6.0
- VectorVest ProTrader 7
- VectorVest RealTime Derby Tool
- VectorVest Simulator
- VectorVest Variator
- VectorVest Watchdog
