

HOT TOPICS LIST
- MACD
- Fibonacci
- RSI
- Gann
- ADXR
- Stochastics
- Volume
- Triangles
- Futures
- Cycles
- Volatility
- ZIGZAG
- MESA
- Retracement
- Aroon
INDICATORS LIST
LIST OF TOPICS
PRINT THIS ARTICLE
by Gary Grosschadl
This index has a strong inverse relationships to the major indexes and traders should note a compelling move here.
Position: N/A
Gary Grosschadl
Independent Canadian equities trader and technical analyst based in Peterborough
Ontario, Canada.
PRINT THIS ARTICLE
VOLATILITY
Volatility Index Marks A Clear And Present Danger
09/29/03 08:28:19 AMby Gary Grosschadl
This index has a strong inverse relationships to the major indexes and traders should note a compelling move here.
Position: N/A
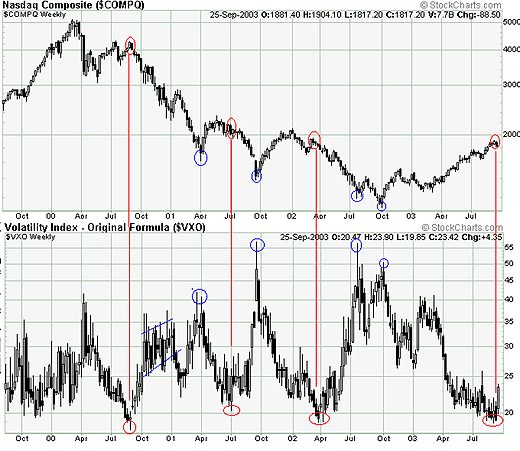
| Just recently the CBOE (Chicago Board Options Exchange) has changed the definition of their Volatility Index - $VIX. Until now, the $VIX was based on options tied to the S&P 100 index because that was the most widely traded index at the time it was introduced. Now the $VIX will be calculated based on options tied to the S&P 500 since this index's popularity has grown substantially. However the original VIX formula has a large following, so the CBOE will continue to publish the data under a new name - $VXO. |
| The Volatility Index is used by stock and options traders to monitor the market's anxiety level. I will continue to use the original formula for VIX now known as VXO. The inverse relationship between the VXO and, in this case the Nasdaq, can be readily seen (broad movements in the markets are basically mirrored by the main indices). What is noteworthy is the movement from one extreme VXO valuation to another. It can be used as a tool for measuring investor fear. High readings above 50 mark periods of maximum fear and relate to important market bottoms. Low readings below 20, while not as accurate and timely as high readings, indicate investor complacency and usually point to market tops. Since the meltdown of 2000, these low readings have in fact been rather revealing. |
|
| Nasdaq and VXO relationship showing corresponding tops and bottoms. |
| Graphic provided by: Stockcharts.com. |
| |
| This long-term weekly chart shows this inverse relationship well. Since 2000 there have only been four occasions of VXO reaching the 20 region (one being a near miss). Each occurrance resulted in an eventual move much higher for VXO and the corresponding downturn for the indices with significant downward corrections of several hundred points. |
| Now we are in a very similar circumstance and traders should be wary, especially since, as I pointed out in a former article ("Weekly Nasdaq Hits The Wall," Traders.com Advantage, 9/16/03), the weekly Nasdaq has topped out at its 200-period EMA. |
Independent Canadian equities trader and technical analyst based in Peterborough
Ontario, Canada.
| Website: | www.whatsonsale.ca/financial.html |
| E-mail address: | gwg7@sympatico.ca |
Click here for more information about our publications!
Comments
Date:�10/08/03Rank:�3Comment:�

Request Information From Our Sponsors
- StockCharts.com, Inc.
- Candle Patterns
- Candlestick Charting Explained
- Intermarket Technical Analysis
- John Murphy on Chart Analysis
- John Murphy's Chart Pattern Recognition
- John Murphy's Market Message
- MurphyExplainsMarketAnalysis-Intermarket Analysis
- MurphyExplainsMarketAnalysis-Visual Analysis
- StockCharts.com
- Technical Analysis of the Financial Markets
- The Visual Investor
- VectorVest, Inc.
- Executive Premier Workshop
- One-Day Options Course
- OptionsPro
- Retirement Income Workshop
- Sure-Fire Trading Systems (VectorVest, Inc.)
- Trading as a Business Workshop
- VectorVest 7 EOD
- VectorVest 7 RealTime/IntraDay
- VectorVest AutoTester
- VectorVest Educational Services
- VectorVest OnLine
- VectorVest Options Analyzer
- VectorVest ProGraphics v6.0
- VectorVest ProTrader 7
- VectorVest RealTime Derby Tool
- VectorVest Simulator
- VectorVest Variator
- VectorVest Watchdog