HOT TOPICS LIST
- MACD
- Fibonacci
- RSI
- Gann
- ADXR
- Stochastics
- Volume
- Triangles
- Futures
- Cycles
- Volatility
- ZIGZAG
- MESA
- Retracement
- Aroon
INDICATORS LIST
LIST OF TOPICS
PRINT THIS ARTICLE
by David Penn
Present weakness in the market most likely presages future strength.
Position: N/A
David Penn
Technical Writer for Technical Analysis of STOCKS & COMMODITIES magazine, Working-Money.com, and Traders.com Advantage.
PRINT THIS ARTICLE
ELLIOTT WAVE
Down For The S&P 500's Upstroke
09/26/03 10:48:40 AMby David Penn
Present weakness in the market most likely presages future strength.
Position: N/A
| Back in early August, I suggested that the market was due for a correction that would lead to significant and enduring price advances in the S&P 500 back above the 1000 level ("A Five-Wave Look at the Spring/Summer Rally of 2003," Traders.com Advantage, August 5, 2003). At the time, I anticipated a steep correction in the S&P 500, a correction that would represent the final "C" wave of a fourth wave correction in Elliott wave terminology. The correction that actually occurred was nowhere as deep as the one I suspected. The "C" wave of wave four found support not at the level of the fourth wave of one smaller degree (a downside to about 920), but instead bottomed about thirty points higher. |
| Since that bottom, the S&P 500 has performed magnificently, rallying from as low as 961 on August 8th to a high of 1040 six weeks later in mid-September for an 8% gain. While the recent, sharp sell-off in the last full week of September no doubt provided many bears with more than a few tinges of vindication, it appears that this -- like the larger, summer fourth wave correction -- has also been part of a constructive decline, and one that most probably will lead to significantly higher values for the S&P 500. |

|
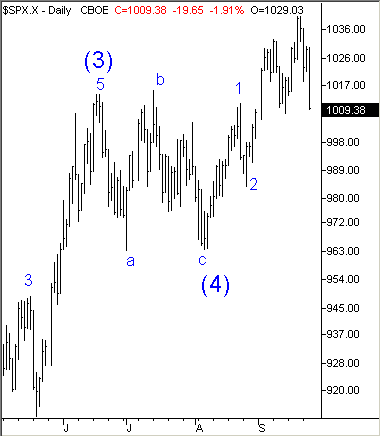
| Figure 1: This fourth wave in the S&P 500's summer consolidation was relatively pain-free, which probably points to greater underlying upside strength in the overall advance. |
| Graphic provided by: TradeStation. |
| |
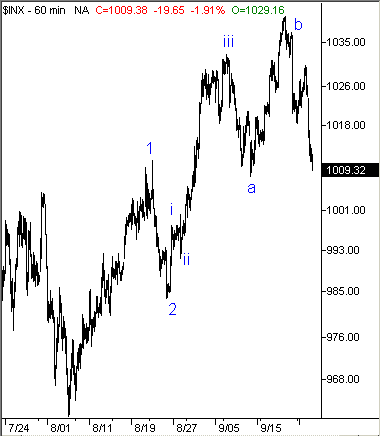
| By the wave count I have used since the fourth wave lows of August, I am suggesting that the S&P 500 is moving into a fifth wave which will end the bull market that began in the S&P 500 back in March. The end of the month correction, which saw the S&P 500 moving toward a test of the 1000 level, is a correction taking place within a third wave, as the chart in Figure 1 indicates. Because wave threes cannot be shorter than wave ones, I have counted the peaks and valleys since the wave two low shown in Figure 2 as waves of one degree smaller and are represented by Roman numerals for easier distinction. Thus a wave three top will develop once the S&P 500 rallies from its present correction and goes on to mark a new high for the March 2003-to-present advance. A somewhat "bigger" picture will probably help a great deal in revealing what I think is a quite probable Elliott wave count for the S&P 500. |
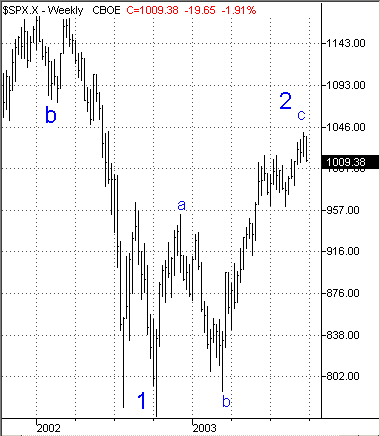
 Figure 2: A strong move up from the fourth wave lows in August experiences a correction near September's end. Many Elliotticians have been somewhat confounded by competing wave counts in recent months -- and I include myself among them. Nevertheless, I believe there is a strong argument that the March 2003 to present advance represents the third and final "c" wave of a countertrend, second wave that began with the October 2002 lows. As I have suggested elsewhere ("Bear Market Rallies," Working-Money.com, May 20, 2003), this price action is very much reminiscent of typically second wave market dynamics and psychology. By this I am referring to the re-embrace of old market leadership (i.e., the love affair with Internet stocks, especially Chinese Internet stocks) and levels of bullishness that rival those of the previous market peak (i.e., the VIX in mid-September 2003 was lower than at any level since the summer of 1998). |
 Figure 3: As this second wave moves toward completion, a third wave of significant magnitude should follow. How high will such a second wave go? The most basic projection comes from applying Stan Weinstein's swing rule to the price troughs from July 2002 to March 2003. With resistance at about 960 and support at the lowest point of the deepest trough at 770, Weinstein's swing rule calls for an upside in the neighborhood of 1150. Importantly, such a projection would be compatible with the current Elliott wave count insofar as the rallying second wave would appropriately still fall short of the high of the primary B wave (the primary B wave representing the market advance from the September 2001 lows to the highs of the spring of 2002). |
Technical Writer for Technical Analysis of STOCKS & COMMODITIES magazine, Working-Money.com, and Traders.com Advantage.
| Title: | Technical Writer |
| Company: | Technical Analysis, Inc. |
| Address: | 4757 California Avenue SW |
| Seattle, WA 98116 | |
| Phone # for sales: | 206 938 0570 |
| Fax: | 206 938 1307 |
| Website: | www.Traders.com |
| E-mail address: | DPenn@traders.com |
Traders' Resource Links | |
| Charting the Stock Market: The Wyckoff Method -- Books | |
| Working-Money.com -- Online Trading Services | |
| Traders.com Advantage -- Online Trading Services | |
| Technical Analysis of Stocks & Commodities -- Publications and Newsletters | |
| Working Money, at Working-Money.com -- Publications and Newsletters | |
| Traders.com Advantage -- Publications and Newsletters | |
| Professional Traders Starter Kit -- Software | |
Click here for more information about our publications!
Comments
Date: 09/27/03Rank: 5Comment:
Date: 10/08/03Rank: 4Comment:

Request Information From Our Sponsors
- StockCharts.com, Inc.
- Candle Patterns
- Candlestick Charting Explained
- Intermarket Technical Analysis
- John Murphy on Chart Analysis
- John Murphy's Chart Pattern Recognition
- John Murphy's Market Message
- MurphyExplainsMarketAnalysis-Intermarket Analysis
- MurphyExplainsMarketAnalysis-Visual Analysis
- StockCharts.com
- Technical Analysis of the Financial Markets
- The Visual Investor
- VectorVest, Inc.
- Executive Premier Workshop
- One-Day Options Course
- OptionsPro
- Retirement Income Workshop
- Sure-Fire Trading Systems (VectorVest, Inc.)
- Trading as a Business Workshop
- VectorVest 7 EOD
- VectorVest 7 RealTime/IntraDay
- VectorVest AutoTester
- VectorVest Educational Services
- VectorVest OnLine
- VectorVest Options Analyzer
- VectorVest ProGraphics v6.0
- VectorVest ProTrader 7
- VectorVest RealTime Derby Tool
- VectorVest Simulator
- VectorVest Variator
- VectorVest Watchdog
