HOT TOPICS LIST
- MACD
- Fibonacci
- RSI
- Gann
- ADXR
- Stochastics
- Volume
- Triangles
- Futures
- Cycles
- Volatility
- ZIGZAG
- MESA
- Retracement
- Aroon
INDICATORS LIST
LIST OF TOPICS
PRINT THIS ARTICLE
by David Penn
An intraday head and shoulders top highlights weakness at the top for semiconductor stocks.
Position: N/A
David Penn
Technical Writer for Technical Analysis of STOCKS & COMMODITIES magazine, Working-Money.com, and Traders.com Advantage.
PRINT THIS ARTICLE
SECTOR INVESTING
Sayonara Semiconductor Stocks
09/29/03 10:55:36 AMby David Penn
An intraday head and shoulders top highlights weakness at the top for semiconductor stocks.
Position: N/A
| In an era of technology-fueled productivity "miracles," it has been said frequently that semiconductor stocks have tended to lead the stock markets up and down. Thus, signs that the rally in the semiconductor sector were stalling in late August and early September, may end up having ramifications that extend beyond the specific fates and fortunes of semiconductor stocks. |
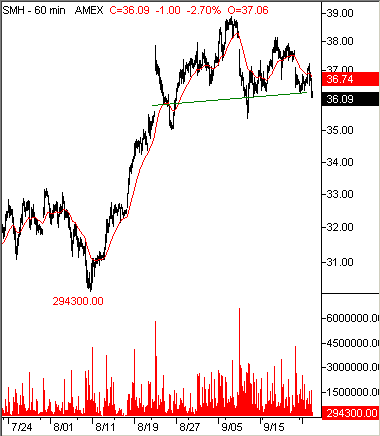
| The stalling in the semiconductor group is quite recognizable in this hourly chart of the semiconductor HOLDRs exchange-traded fund. On this hourly chart it appears as if the semiconductor HOLDR, SMH, has developed a head and shoulders top with a formation size of approximately $4 (a high of $39 and a low of about $35). |

|
| Figure 1: A head and shoulders top in this hourly chart of the SMH suggests a correction is in the near-term future for semiconductor stocks. |
| Graphic provided by: TradeStation. |
| |
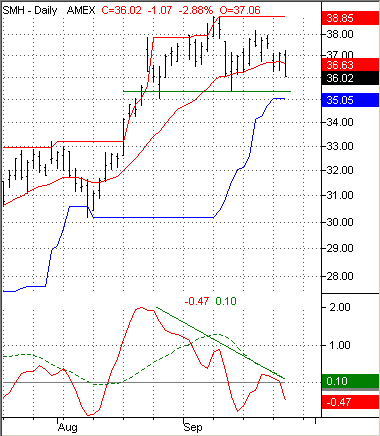
| While the formation itself is unmistakably bearish, the size of the formation suggests that any correction in SMH will be relatively contained. Weinstein's swing rule, for example, points to a downside in the neighborhood of $31. This would take away most of the advance in the SMH since mid-August. But it also means there is a likelihood that a collapsing SMH might find support along the August lows just north of $30. This support is shown in blue by the lower rung of the 20-day price channel. |
 Figure 2: A negative divergence with the 3/10 oscillator hints at lower prices going forward for SMH. This may be more than a mere correction for some of the weaker stocks in the semiconductor group. Some of the semiconductor stocks that appear, at this moment, to be particularly weak are stocks like Applied Materials (AMAT), Linear Technology Corporation (LLTC), and Maxim Integrated Products, Inc. (MXIM). All three of these stocks have fallen below their 50-day moving averages which, while not decisive, does point to possible weakness if semiconductor stocks as a group remain under pressure. |
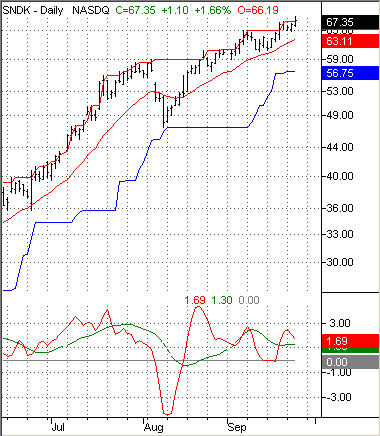
 Figure 3: In spite of a negative divergence, SanDisk Corporation continues to advance--at least for now. There is one semiconductor stock that has continued to make relatively impressive gains, that stock being SanDisk Corporation, which was actually making a new high on Wednesday, September 24th during a time of broad-based stock market weakness. |
Technical Writer for Technical Analysis of STOCKS & COMMODITIES magazine, Working-Money.com, and Traders.com Advantage.
| Title: | Technical Writer |
| Company: | Technical Analysis, Inc. |
| Address: | 4757 California Avenue SW |
| Seattle, WA 98116 | |
| Phone # for sales: | 206 938 0570 |
| Fax: | 206 938 1307 |
| Website: | www.Traders.com |
| E-mail address: | DPenn@traders.com |
Traders' Resource Links | |
| Charting the Stock Market: The Wyckoff Method -- Books | |
| Working-Money.com -- Online Trading Services | |
| Traders.com Advantage -- Online Trading Services | |
| Technical Analysis of Stocks & Commodities -- Publications and Newsletters | |
| Working Money, at Working-Money.com -- Publications and Newsletters | |
| Traders.com Advantage -- Publications and Newsletters | |
| Professional Traders Starter Kit -- Software | |
Click here for more information about our publications!
Comments
Date: 09/30/03Rank: 4Comment:
Date: 09/30/03Rank: 5Comment:

|

Request Information From Our Sponsors
- StockCharts.com, Inc.
- Candle Patterns
- Candlestick Charting Explained
- Intermarket Technical Analysis
- John Murphy on Chart Analysis
- John Murphy's Chart Pattern Recognition
- John Murphy's Market Message
- MurphyExplainsMarketAnalysis-Intermarket Analysis
- MurphyExplainsMarketAnalysis-Visual Analysis
- StockCharts.com
- Technical Analysis of the Financial Markets
- The Visual Investor
- VectorVest, Inc.
- Executive Premier Workshop
- One-Day Options Course
- OptionsPro
- Retirement Income Workshop
- Sure-Fire Trading Systems (VectorVest, Inc.)
- Trading as a Business Workshop
- VectorVest 7 EOD
- VectorVest 7 RealTime/IntraDay
- VectorVest AutoTester
- VectorVest Educational Services
- VectorVest OnLine
- VectorVest Options Analyzer
- VectorVest ProGraphics v6.0
- VectorVest ProTrader 7
- VectorVest RealTime Derby Tool
- VectorVest Simulator
- VectorVest Variator
- VectorVest Watchdog
