HOT TOPICS LIST
- MACD
- Fibonacci
- RSI
- Gann
- ADXR
- Stochastics
- Volume
- Triangles
- Futures
- Cycles
- Volatility
- ZIGZAG
- MESA
- Retracement
- Aroon
INDICATORS LIST
LIST OF TOPICS
PRINT THIS ARTICLE
by David Penn
Support for the U.S. Dollar Index at 93-92 will be sorely tested in the weeks to come.
Position: N/A
David Penn
Technical Writer for Technical Analysis of STOCKS & COMMODITIES magazine, Working-Money.com, and Traders.com Advantage.
PRINT THIS ARTICLE
SUPPORT & RESISTANCE
The Do Or Die Dollar
09/23/03 12:00:36 PMby David Penn
Support for the U.S. Dollar Index at 93-92 will be sorely tested in the weeks to come.
Position: N/A
| I have written repeatedly (stubbornly, if you will) about the potential for a significant bounce in the U.S. Dollar index. My reasons have been economic, financial and technical, and are well chronicled in Traders.com Advantage ("September Greenback's 1-2-3 Reversal," June 26, 2003) and in Working-Money.com (most recently in "Kings of Commodities," August 13, 2003; but also earlier this year in "Down Goes the Dollar," February 11, 2003). I should add that contributor Gary Grosschadl has also written perceptively about the U.S. Dollar index for Traders.com Advantage (most recently, "U.S. Dollar and Euro Fighting Same Battle," September 2, 2003). |
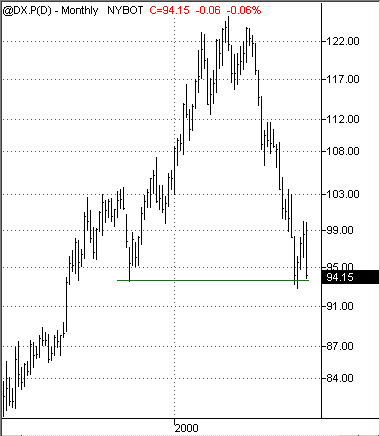
| The U.S. Dollar index, in the wake of the sudden rally in global currencies -- particularly the yen -- is at a critical juncture. After rallying from a test of the 1998 lows in mid-June, the U.S. Dollar index climbed from a low of 92.80 to an intraday high just over 100 by mid-August. But as August continued, the greenback weakened and, after a G-7 conference in Dubai, (about which Morgan Stanley economist Stephen Roach observed triumphantly, "an unbalanced global economy has finally come to its senses"), turned weakness into near rout as the index fell from just under 100 in late August to barely above 94 by mid-September. |

|
| Figure 1: The fall of 2003 finds the U.S. Dollar Index once again flirting with multi-year lows. |
| Graphic provided by: TradeStation. |
| |
| Thus, once again the greenback finds itself in the neighborhood of its 1998 lows. The last time the U.S. dollar was in this territory -- back in the summer of 2003 -- dollar bearishness was rampant: gold, while not as high as it was in February, was above $370, and currencies such as the euro were at all time highs. In recent days, this scenario has replayed itself, with gold at least temporarily breaching its February highs and the euro still hovering around all-time highs. Will greenback bears -- the gold bugs and holders of foreign currencies -- be disappointed once again? |
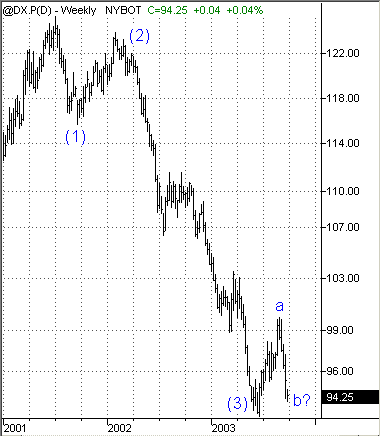
| Perhaps -- though this disappointment may only be temporary. The dollar has fallen from its mid-2001 heights in three clear waves: a decline from the peak at 125.50 to 115.67, a rally from 115.67 to 124 by the end of 2001, and the decline from 124 to 92.80 in June 2003. This third wave down features what Elliotticians refer to as "extensions" -- a pair of consolidations in the middle of 2002 and again during the first quarter of 2003. But there has been no significant retracement of this mammoth move down. The most recently ended greenback rally, from June to August, saw a gain of just under eight points, for a retracement of a little over 25% of the January 2002 to June 2003, 31-point decline. |
 Figure 2: The price action in the greenback since June 2003 could be a fourth wave correction that will see a higher U.S. Dollar index before a lower one -- if support at the 93-92 level holds once again. This suggests one of two possibilities, to my mind: either the greenback is headed immediately down much farther to a level where it is sufficiently oversold for a major retracement (at least 38% or so) to the upside to occur, or that the greenback is still in the process of retracing the January 2002 to June 2003 move down. I still find the second possibility a more compelling near-term likelihood, particularly given the level of support at the 93-92 level, and the price action in the greenback from 1997 to 1999 when it traded in a range between 103 and 92 on its way from the 1995 lows near 80 to the 2001 highs above 125. In fact, a case can be made for a three-part, countertrend retracement in which the June-August 2003 advance represents a wave (a), the current collapse and potential retest of the 93-92 level represents wave (b), with a wave (c) yet to come. My target for a bounce in the U.S. Dollar Index remains 103-104 -- given support at the 93-92 level. This is based on both a minimum Fibonacci retracement of 38.2% of the January 2002 to June 2003 decline, as well as on the price action between 1997 and 1999 mentioned before, in which the 103 level served as temporary resistance during the greenback's 1995-2001 bull market. |
Technical Writer for Technical Analysis of STOCKS & COMMODITIES magazine, Working-Money.com, and Traders.com Advantage.
| Title: | Technical Writer |
| Company: | Technical Analysis, Inc. |
| Address: | 4757 California Avenue SW |
| Seattle, WA 98116 | |
| Phone # for sales: | 206 938 0570 |
| Fax: | 206 938 1307 |
| Website: | www.Traders.com |
| E-mail address: | DPenn@traders.com |
Traders' Resource Links | |
| Charting the Stock Market: The Wyckoff Method -- Books | |
| Working-Money.com -- Online Trading Services | |
| Traders.com Advantage -- Online Trading Services | |
| Technical Analysis of Stocks & Commodities -- Publications and Newsletters | |
| Working Money, at Working-Money.com -- Publications and Newsletters | |
| Traders.com Advantage -- Publications and Newsletters | |
| Professional Traders Starter Kit -- Software | |
Click here for more information about our publications!
Comments
Date: 09/25/03Rank: 4Comment:

Request Information From Our Sponsors
- StockCharts.com, Inc.
- Candle Patterns
- Candlestick Charting Explained
- Intermarket Technical Analysis
- John Murphy on Chart Analysis
- John Murphy's Chart Pattern Recognition
- John Murphy's Market Message
- MurphyExplainsMarketAnalysis-Intermarket Analysis
- MurphyExplainsMarketAnalysis-Visual Analysis
- StockCharts.com
- Technical Analysis of the Financial Markets
- The Visual Investor
- VectorVest, Inc.
- Executive Premier Workshop
- One-Day Options Course
- OptionsPro
- Retirement Income Workshop
- Sure-Fire Trading Systems (VectorVest, Inc.)
- Trading as a Business Workshop
- VectorVest 7 EOD
- VectorVest 7 RealTime/IntraDay
- VectorVest AutoTester
- VectorVest Educational Services
- VectorVest OnLine
- VectorVest Options Analyzer
- VectorVest ProGraphics v6.0
- VectorVest ProTrader 7
- VectorVest RealTime Derby Tool
- VectorVest Simulator
- VectorVest Variator
- VectorVest Watchdog
