

HOT TOPICS LIST
- MACD
- Fibonacci
- RSI
- Gann
- ADXR
- Stochastics
- Volume
- Triangles
- Futures
- Cycles
- Volatility
- ZIGZAG
- MESA
- Retracement
- Aroon
INDICATORS LIST
LIST OF TOPICS
PRINT THIS ARTICLE
by David Penn
A massive head and shoulders bottom in the Japanese yen suggests that the bull market in yen is on.
Position: N/A
David Penn
Technical Writer for Technical Analysis of STOCKS & COMMODITIES magazine, Working-Money.com, and Traders.com Advantage.
PRINT THIS ARTICLE
HEAD & SHOULDERS
Now And Yen
09/23/03 08:09:07 AMby David Penn
A massive head and shoulders bottom in the Japanese yen suggests that the bull market in yen is on.
Position: N/A
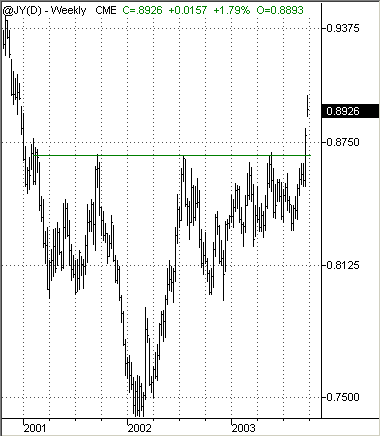
| Recent price action in the Japanese yen has encouraged me to revisit one of the longer-term technical observations I have presented in Traders.com Advantage. Back in January of this year, in a piece called "The Yen's Head and Shoulders Bottom" (January 24, 2003; Traders.com Advantage), I made the case for a much higher price in the Japanese yen. At the time, the yen was trading at about 0.8500 (basis continuous futures), and appeared to be finishing off the head and shoulders bottom with an advance that began in December 2002 from about 0.7950. I suggested then that, this bullishness notwithstanding, "success would be defined as a breakout above the 0.8750/0.8867 level." |
| In a follow-up piece a few months later ("Revisiting the Yen's Head and Shoulders Bottom," May 15, 2003; Traders.com Advantage), I pointed out that "the yen. . . is only up by a smallish margin. . . but its head and shoulders bottom appears all the more ready to reach completion." At this time, the yen (again, basis continuous futures) was trading almost 650 points higher, but was still running into resistance at what I called a downwardly sloping neckline. Positive divergences with indicators (see the MACD chart in the May article) continued to anticipate higher yen prices, and the formation size still called for a yen price in the neighborhood of 0.9915. Yet given the determination of the Japanese government to intervene to keep the yen price down -- and the apparently willingness of yen traders to take them at their word -- a rising yen seemed more than a little of an uphill battle. |
|
| This breakout from a two and a half year head and shoulders bottom suggests a major move to the upside in the Japanese yen. |
| Graphic provided by: TradeStation. |
| |
| As the saying goes, that was then. Higher weekly lows in December 2002 (0.7956), March 2003 (0.8220), and August 2003 (just shy of 0.8300) have finally produced the breakout that yen bulls have been longing for. While the G7 meeting in Dubai recently will be credited for "releasing" the yen, the fact of the matter is that higher prices had been "in" the yen for sometime. As market technicians from Charles Dow's era to the present have never tired of reminding the rest of us, market manipulation can only last for so long. In the long run, the market will go where it wants to go. And certainly since the early days of 2003, it has been clear that the yen wanted to go higher. |
| Incidentally, for those less than convinced of the validity of a two and a half year head and shoulders bottom, there is a strong argument for a mere year and a half long ascending triangle that begins with the yen's lows in the fourth quarter of 2002. Such a triangle has an upside about half as much as that from the head and shoulders bottom. But the fundamental point, the yen is moving higher, is the same. |
Technical Writer for Technical Analysis of STOCKS & COMMODITIES magazine, Working-Money.com, and Traders.com Advantage.
| Title: | Technical Writer |
| Company: | Technical Analysis, Inc. |
| Address: | 4757 California Avenue SW |
| Seattle, WA 98116 | |
| Phone # for sales: | 206 938 0570 |
| Fax: | 206 938 1307 |
| Website: | www.Traders.com |
| E-mail address: | DPenn@traders.com |
Traders' Resource Links | |
| Charting the Stock Market: The Wyckoff Method -- Books | |
| Working-Money.com -- Online Trading Services | |
| Traders.com Advantage -- Online Trading Services | |
| Technical Analysis of Stocks & Commodities -- Publications and Newsletters | |
| Working Money, at Working-Money.com -- Publications and Newsletters | |
| Traders.com Advantage -- Publications and Newsletters | |
| Professional Traders Starter Kit -- Software | |
Click here for more information about our publications!
PRINT THIS ARTICLE

Request Information From Our Sponsors
- StockCharts.com, Inc.
- Candle Patterns
- Candlestick Charting Explained
- Intermarket Technical Analysis
- John Murphy on Chart Analysis
- John Murphy's Chart Pattern Recognition
- John Murphy's Market Message
- MurphyExplainsMarketAnalysis-Intermarket Analysis
- MurphyExplainsMarketAnalysis-Visual Analysis
- StockCharts.com
- Technical Analysis of the Financial Markets
- The Visual Investor
- VectorVest, Inc.
- Executive Premier Workshop
- One-Day Options Course
- OptionsPro
- Retirement Income Workshop
- Sure-Fire Trading Systems (VectorVest, Inc.)
- Trading as a Business Workshop
- VectorVest 7 EOD
- VectorVest 7 RealTime/IntraDay
- VectorVest AutoTester
- VectorVest Educational Services
- VectorVest OnLine
- VectorVest Options Analyzer
- VectorVest ProGraphics v6.0
- VectorVest ProTrader 7
- VectorVest RealTime Derby Tool
- VectorVest Simulator
- VectorVest Variator
- VectorVest Watchdog