HOT TOPICS LIST
- MACD
- Fibonacci
- RSI
- Gann
- ADXR
- Stochastics
- Volume
- Triangles
- Futures
- Cycles
- Volatility
- ZIGZAG
- MESA
- Retracement
- Aroon
INDICATORS LIST
LIST OF TOPICS
PRINT THIS ARTICLE
by Gary Grosschadl
Gold has been very bullish on the daily, weekly and monthly charts.
Position: Buy
Gary Grosschadl
Independent Canadian equities trader and technical analyst based in Peterborough
Ontario, Canada.
PRINT THIS ARTICLE
DOUBLE BOTTOMS
Monthly Chart Shows Gold Upside Target
09/22/03 10:01:17 AMby Gary Grosschadl
Gold has been very bullish on the daily, weekly and monthly charts.
Position: Buy
| On these varied time frames the price of gold is above its 20-period EMA and this is always a very bullish indication. The question is has it topped out? I think the monthly chart of all the charts shows a definable upside pattern target. |
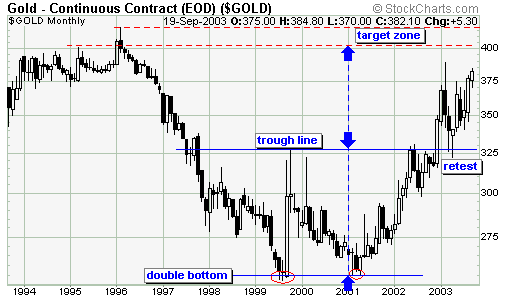
| This long-term chart shows a double bottom formation. It does not have the most convincing symmetry due to the speed that the trough line was established but it certainly fits the bill otherwise. After forming the second bottom early in 2001, it has made a bold drive up to the trough line in 2002 as it touched $330. Within two months it came back down to successfully test support at $300. The next drive up beat the trough line resistance. Gold's volatile action was apparent even on this long-term chart as a dash up to $388 was followed by a reversal and successful retest of the trough line at $327. |

|
| Gold's monthly chart showing a target of $400 or better. |
| Graphic provided by: Stockcharts.com. |
| |
| This successful retest was a strong signal that new highs were coming and they are quickly approaching. In fact last month was the highest close since 1997. |
| The upside target for this double bottom formation is measured by applying the distance from the double bottom to the trough line and adding it above the trough line break. This brings it to $402. Since a previous high was established around $420 back in 1996, it is prudent to have a target zone of $400-420 to encompass that mark and the double bottom measure. |
| This does not mean this target will not be surpassed but it does make a reversal or at least a consolidation a likely possibility in or near this target zone. Gold remains bullish and also volatile so traders should remain watchful of their positions. |
Independent Canadian equities trader and technical analyst based in Peterborough
Ontario, Canada.
| Website: | www.whatsonsale.ca/financial.html |
| E-mail address: | gwg7@sympatico.ca |
Click here for more information about our publications!
Comments
Date: 09/24/03Rank: 4Comment: any analysis of silver?
Date: 10/01/03Rank: 5Comment:

|

Request Information From Our Sponsors
- StockCharts.com, Inc.
- Candle Patterns
- Candlestick Charting Explained
- Intermarket Technical Analysis
- John Murphy on Chart Analysis
- John Murphy's Chart Pattern Recognition
- John Murphy's Market Message
- MurphyExplainsMarketAnalysis-Intermarket Analysis
- MurphyExplainsMarketAnalysis-Visual Analysis
- StockCharts.com
- Technical Analysis of the Financial Markets
- The Visual Investor
- VectorVest, Inc.
- Executive Premier Workshop
- One-Day Options Course
- OptionsPro
- Retirement Income Workshop
- Sure-Fire Trading Systems (VectorVest, Inc.)
- Trading as a Business Workshop
- VectorVest 7 EOD
- VectorVest 7 RealTime/IntraDay
- VectorVest AutoTester
- VectorVest Educational Services
- VectorVest OnLine
- VectorVest Options Analyzer
- VectorVest ProGraphics v6.0
- VectorVest ProTrader 7
- VectorVest RealTime Derby Tool
- VectorVest Simulator
- VectorVest Variator
- VectorVest Watchdog
