HOT TOPICS LIST
- MACD
- Fibonacci
- RSI
- Gann
- ADXR
- Stochastics
- Volume
- Triangles
- Futures
- Cycles
- Volatility
- ZIGZAG
- MESA
- Retracement
- Aroon
INDICATORS LIST
LIST OF TOPICS
PRINT THIS ARTICLE
by David Penn
Negative divergences and parabolic moves to the upside suggest caution may be prudent for bean bulls.
Position: N/A
David Penn
Technical Writer for Technical Analysis of STOCKS & COMMODITIES magazine, Working-Money.com, and Traders.com Advantage.
PRINT THIS ARTICLE
REVERSAL
Is The Soybean Complex Slipping?
09/19/03 09:59:34 AMby David Penn
Negative divergences and parabolic moves to the upside suggest caution may be prudent for bean bulls.
Position: N/A
| About a month ago, I pointed to the potential for explosive moves to the upside in the grains ("Grains Gone Wild," Traders.com Advantage, August 15, 2003) during the second half of the summer. At the time, wheat futures had already advanced strongly, taking out their summer highs just above 346 (basis September) during their July rally and closing above 370 early in August. Both corn and soybeans were just barely beginning to make their moves, with both of these grains bottoming in August. |
| Since that time, both corn and soybeans did in fact "go wild." Soybeans, for their part, shot up from 507 early in August to close above 620 in early September (basis November). The bullish spirits in soybeans emanated throughout the entire so-called "soybean complex," which includes soybean meal and soybean oil. Meal and oil both made bottoms in early August, mere days before the final bottom in soybeans and both products participated in the strong, gap-heavy rally that characterized the rise of the soybean complex in August. |

|
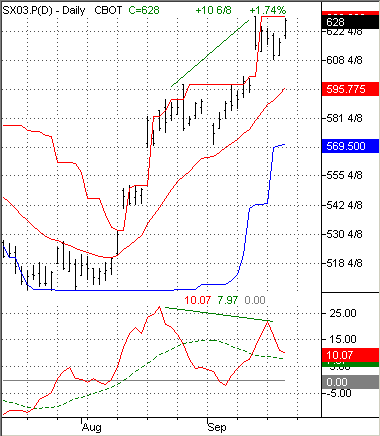
| Figure 1: A stark divergence between price action and the 3/10 oscillator suggests limited upside for November soybeans going forward. |
| Graphic provided by: TradeStation. |
| |
| However, the sharpness of the advances in August appears to have left the three members of the soybean complex vulnerable to reversal. This is particularly so in the case of December soybean meal and November soybeans, both of which have developed significant negative divergences between their price action and the 3/10 oscillator (see Raschke and Connors, Street Smarts for more on the 3/10 oscillator). |
| Note that November soybeans made a high in mid-August near 596, then went on to make a significantly higher high above 625 in mid-September. At the same time, the 3/10 oscillator made a high in mid-August, but registered a lower high in mid-September -- at the same time that November soybeans were making a new contract high. While November soybeans are consolidating between 628 and 608 (a fairly wide range, to be sure), it does appear that upside momentum has been lost -- at least for the moment. Given the distance between the current lows and the 20-day exponential moving average, it seems as if there is plenty of room for November soybeans to correct -- whether or not such a correction would mean the beginning of a new trend to the downside. The situation with December soybean meal is similar. In fact, a case can be made that not only has December soybean meal produced a negative divergence between prices and the oscillator, but also the first two-thirds of a head and shoulders top may be developing. |
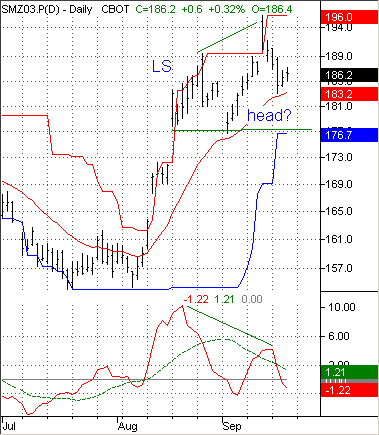
 Figure 2: A negative divergence and a possible head and shoulders top hint at a reversal in December soybean meal. Here, in addition to the negative divergence between the higher high in December soybean meal in mid-September and the lower high in the 3/10 oscillator, there appears to be a potential head and shoulders top in the making, as well. What would it take for the head and shoulders top to fully develop? At this point, December soybean meal would need to find support at about 177 and bounce -- perhaps as high as 190, though any bounce that was big enough to be noticed would likely satisfy the head and shoulders requirement for a right shoulder. Thus, immediate-term weakness to 177, a bounce, and then a resumption of the downward action that began in mid-September, action that should take soybean meal prices down below a "neckline" support level at 177. A successful head and shoulders top in December soybean meal would have a downside of 160, given a formation size of about 17 and a breakdown level of 177. |
Technical Writer for Technical Analysis of STOCKS & COMMODITIES magazine, Working-Money.com, and Traders.com Advantage.
| Title: | Technical Writer |
| Company: | Technical Analysis, Inc. |
| Address: | 4757 California Avenue SW |
| Seattle, WA 98116 | |
| Phone # for sales: | 206 938 0570 |
| Fax: | 206 938 1307 |
| Website: | www.Traders.com |
| E-mail address: | DPenn@traders.com |
Traders' Resource Links | |
| Charting the Stock Market: The Wyckoff Method -- Books | |
| Working-Money.com -- Online Trading Services | |
| Traders.com Advantage -- Online Trading Services | |
| Technical Analysis of Stocks & Commodities -- Publications and Newsletters | |
| Working Money, at Working-Money.com -- Publications and Newsletters | |
| Traders.com Advantage -- Publications and Newsletters | |
| Professional Traders Starter Kit -- Software | |
Click here for more information about our publications!
Comments
Date: 09/21/03Rank: 2Comment:

|

Request Information From Our Sponsors
- StockCharts.com, Inc.
- Candle Patterns
- Candlestick Charting Explained
- Intermarket Technical Analysis
- John Murphy on Chart Analysis
- John Murphy's Chart Pattern Recognition
- John Murphy's Market Message
- MurphyExplainsMarketAnalysis-Intermarket Analysis
- MurphyExplainsMarketAnalysis-Visual Analysis
- StockCharts.com
- Technical Analysis of the Financial Markets
- The Visual Investor
- VectorVest, Inc.
- Executive Premier Workshop
- One-Day Options Course
- OptionsPro
- Retirement Income Workshop
- Sure-Fire Trading Systems (VectorVest, Inc.)
- Trading as a Business Workshop
- VectorVest 7 EOD
- VectorVest 7 RealTime/IntraDay
- VectorVest AutoTester
- VectorVest Educational Services
- VectorVest OnLine
- VectorVest Options Analyzer
- VectorVest ProGraphics v6.0
- VectorVest ProTrader 7
- VectorVest RealTime Derby Tool
- VectorVest Simulator
- VectorVest Variator
- VectorVest Watchdog
