HOT TOPICS LIST
- MACD
- Fibonacci
- RSI
- Gann
- ADXR
- Stochastics
- Volume
- Triangles
- Futures
- Cycles
- Volatility
- ZIGZAG
- MESA
- Retracement
- Aroon
INDICATORS LIST
LIST OF TOPICS
PRINT THIS ARTICLE
by Koos van der Merwe
The Jean Coutu Group (CA: PJCA) is the second largest drugstore chain in Canada and the eighth-largest in North America, with 311 pharmacy stores in Quebec, Ontario, New Brunswick, and 332 Brooks pharmacies in the U.S. northeast. The company may be making significant acquisitions in the northeastern U.S. by Christmas. Rumor or fact?
Position: Buy
Koos van der Merwe
Has been a technical analyst since 1969, and has worked as a futures and options trader with First Financial Futures in Johannesburg, South Africa.
PRINT THIS ARTICLE
HEAD & SHOULDERS
The Jean Coutu Group
09/18/03 01:24:44 PMby Koos van der Merwe
The Jean Coutu Group (CA: PJCA) is the second largest drugstore chain in Canada and the eighth-largest in North America, with 311 pharmacy stores in Quebec, Ontario, New Brunswick, and 332 Brooks pharmacies in the U.S. northeast. The company may be making significant acquisitions in the northeastern U.S. by Christmas. Rumor or fact?
Position: Buy
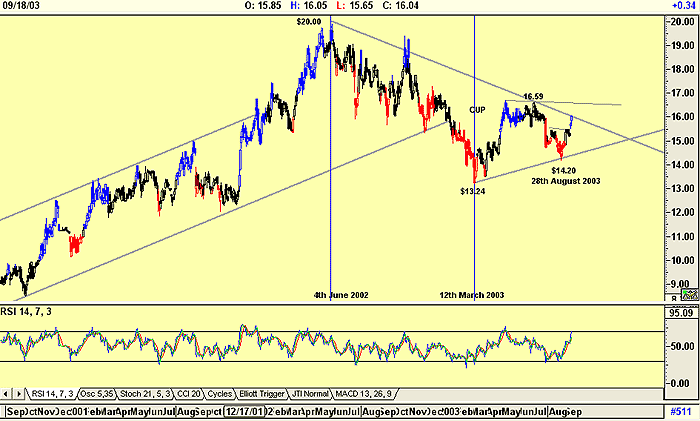
| Jean Coutu's share price has moved from a low (not shown on the chart) in April 2000 of $6.80, to a high of $20.00 on June 4, 2002. From that high it dropped steadily, breaking its support line to reach a low of $13.24 on March 12, 2003. It then rose to form a double top formation at $16.59 in what could be a cup and handle pattern. |

|
| Figure 1: Long-term chart of the Jean Coutu Group. |
| Graphic provided by: AdvancedGET. |
| |
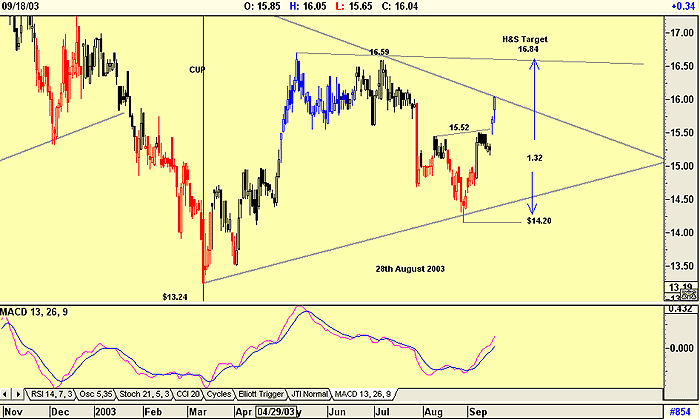
| However, the share price fell to $14.20 on August 28, and has now risen to form an inverted head and shoulder pattern. Looking at the second chart, both the cup and handle and inverted head and shoulders formations can be seen. |
 Figure 2: Short-term chart of the Jean Coutu Group. Now comes the interesting part. The inverted head and shoulders formation gives a target of $16.84, which is above the $16.59 of the handle for the cup and handle formation. This suggests that in reaching the target of $16.84, the share price will form a new target of $19.94. ($16.59 - $13.24 = $3.35 + $16.59 = $19.94.) |
| Both charts show positive indicators, with the long-term chart using RSI, and the short-term using MACD. Definitely a stock to place on your watch list for a buy on any retracement. |
Has been a technical analyst since 1969, and has worked as a futures and options trader with First Financial Futures in Johannesburg, South Africa.
| Address: | 3256 West 24th Ave |
| Vancouver, BC | |
| Phone # for sales: | 6042634214 |
| E-mail address: | petroosp@gmail.com |
Click here for more information about our publications!
PRINT THIS ARTICLE

Request Information From Our Sponsors
- VectorVest, Inc.
- Executive Premier Workshop
- One-Day Options Course
- OptionsPro
- Retirement Income Workshop
- Sure-Fire Trading Systems (VectorVest, Inc.)
- Trading as a Business Workshop
- VectorVest 7 EOD
- VectorVest 7 RealTime/IntraDay
- VectorVest AutoTester
- VectorVest Educational Services
- VectorVest OnLine
- VectorVest Options Analyzer
- VectorVest ProGraphics v6.0
- VectorVest ProTrader 7
- VectorVest RealTime Derby Tool
- VectorVest Simulator
- VectorVest Variator
- VectorVest Watchdog
- StockCharts.com, Inc.
- Candle Patterns
- Candlestick Charting Explained
- Intermarket Technical Analysis
- John Murphy on Chart Analysis
- John Murphy's Chart Pattern Recognition
- John Murphy's Market Message
- MurphyExplainsMarketAnalysis-Intermarket Analysis
- MurphyExplainsMarketAnalysis-Visual Analysis
- StockCharts.com
- Technical Analysis of the Financial Markets
- The Visual Investor
