HOT TOPICS LIST
- MACD
- Fibonacci
- RSI
- Gann
- ADXR
- Stochastics
- Volume
- Triangles
- Futures
- Cycles
- Volatility
- ZIGZAG
- MESA
- Retracement
- Aroon
INDICATORS LIST
LIST OF TOPICS
PRINT THIS ARTICLE
by David Penn
A mid-summer double top leads to a late summer double bottom as the rally in lean hog futures continues.
Position: N/A
David Penn
Technical Writer for Technical Analysis of STOCKS & COMMODITIES magazine, Working-Money.com, and Traders.com Advantage.
PRINT THIS ARTICLE
DOUBLE BOTTOMS
Are Hogs Headed Higher?
09/18/03 09:08:26 AMby David Penn
A mid-summer double top leads to a late summer double bottom as the rally in lean hog futures continues.
Position: N/A
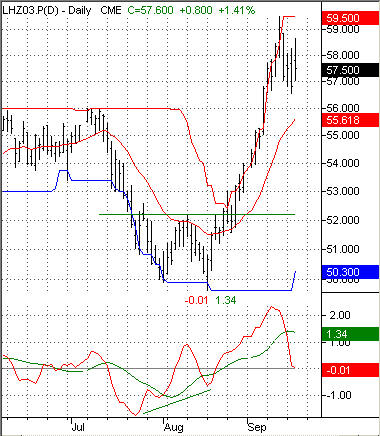
| Back in late July, I pointed to a double top formation in October lean hog futures that appeared to be quite close to meeting its downside projection ("A Double Top in October Hogs," Traders.com Advantage, July 24, 2003). Interestingly, just as hogs reached that projection, they formed a double bottom and began moving back up. In some ways, the double bottom in lean hogs (basis December futures) was the mirror image of the previous month's double top in lean hogs (basis October). In both cases, the impending reversals were anticipated by divergences in oscillators. |
| Note how the 3/10 oscillator (see Linda Bradford Raschke and Lawrence Connor's excellent swing-trading guide, Street Smarts for more on the 3/10 oscillator) made higher lows in mid-July, late July and again in mid-August. At the same time, the December lean hogs contract was making lower lows from mid-July to late July. Even the mid-August low in December hogs was a lower low -- albeit only on an intraday basis. The phenomenon of an indicator making higher lows while price action is making lower lows is the definition of a positive divergence and, here, suggested that December hogs were quite likely establishing a bottom. The fact that prices had reached the downside price objective from the June-July double top only underscored the possibility of a significant reversal. |

|
| A positive divergence signaled a bottom in December hogs. The double bottom from late July to mid-August suggested that a rally to at least 54 was likely. |
| Graphic provided by: TradeStation. |
| |
| Combined with the positive divergence, the late summer double bottom appeared to confirm the likelihood of a price reversal. Specifically, the double bottom indicated a rally to at least 54 in an initial advance. After breaking out from the double bottom, December hogs continued higher, reaching the upside projection of 54 before the end of the month. Not only did prices reach their objective, but they surpassed it, moving another five cents higher into September before appearing to reach a peak of 59.50 on September 11th. |
| The question at this point, of course, is whether or not hogs are poised to move even higher. The sharpness of their rally in late August and into September is such that it is no surprise the market became exceptionally overbought by mid-September. So far, however, the correction to this sharp move has been relatively mild as December lean hog futures prices have moved sideways instead of straight down. Moreover, the upper, 20-day price channel provides a significant amount of support at the 56 level should prices begin to slip. |
| But even if this suggests that hogs aren't likely to move much lower, is there a credible argument that hogs will move higher? The Elliott wave student in me sees in the price action since late July the possibility of a five wave impulsive pattern. More to the point, this five wave pattern appears to be in the process of forming a fourth wave in September, a fourth wave from which a fifth and final upward thrust is to be expected. If the oscillator moves into oversold territory without any major retracement in prices (possibly by way of price weakness that nevertheless finds support at the upper, 20-day price channel), then the possibility of higher prices for December lean hog futures, it seems to me, would increase significantly. |
Technical Writer for Technical Analysis of STOCKS & COMMODITIES magazine, Working-Money.com, and Traders.com Advantage.
| Title: | Technical Writer |
| Company: | Technical Analysis, Inc. |
| Address: | 4757 California Avenue SW |
| Seattle, WA 98116 | |
| Phone # for sales: | 206 938 0570 |
| Fax: | 206 938 1307 |
| Website: | www.Traders.com |
| E-mail address: | DPenn@traders.com |
Traders' Resource Links | |
| Charting the Stock Market: The Wyckoff Method -- Books | |
| Working-Money.com -- Online Trading Services | |
| Traders.com Advantage -- Online Trading Services | |
| Technical Analysis of Stocks & Commodities -- Publications and Newsletters | |
| Working Money, at Working-Money.com -- Publications and Newsletters | |
| Traders.com Advantage -- Publications and Newsletters | |
| Professional Traders Starter Kit -- Software | |
Click here for more information about our publications!
Comments

Request Information From Our Sponsors
- VectorVest, Inc.
- Executive Premier Workshop
- One-Day Options Course
- OptionsPro
- Retirement Income Workshop
- Sure-Fire Trading Systems (VectorVest, Inc.)
- Trading as a Business Workshop
- VectorVest 7 EOD
- VectorVest 7 RealTime/IntraDay
- VectorVest AutoTester
- VectorVest Educational Services
- VectorVest OnLine
- VectorVest Options Analyzer
- VectorVest ProGraphics v6.0
- VectorVest ProTrader 7
- VectorVest RealTime Derby Tool
- VectorVest Simulator
- VectorVest Variator
- VectorVest Watchdog
- StockCharts.com, Inc.
- Candle Patterns
- Candlestick Charting Explained
- Intermarket Technical Analysis
- John Murphy on Chart Analysis
- John Murphy's Chart Pattern Recognition
- John Murphy's Market Message
- MurphyExplainsMarketAnalysis-Intermarket Analysis
- MurphyExplainsMarketAnalysis-Visual Analysis
- StockCharts.com
- Technical Analysis of the Financial Markets
- The Visual Investor
